Updating Reports
Initial Report Requirements
This time around we will use the draft report generated by either Drafting Reports or Streamlined Workflow.
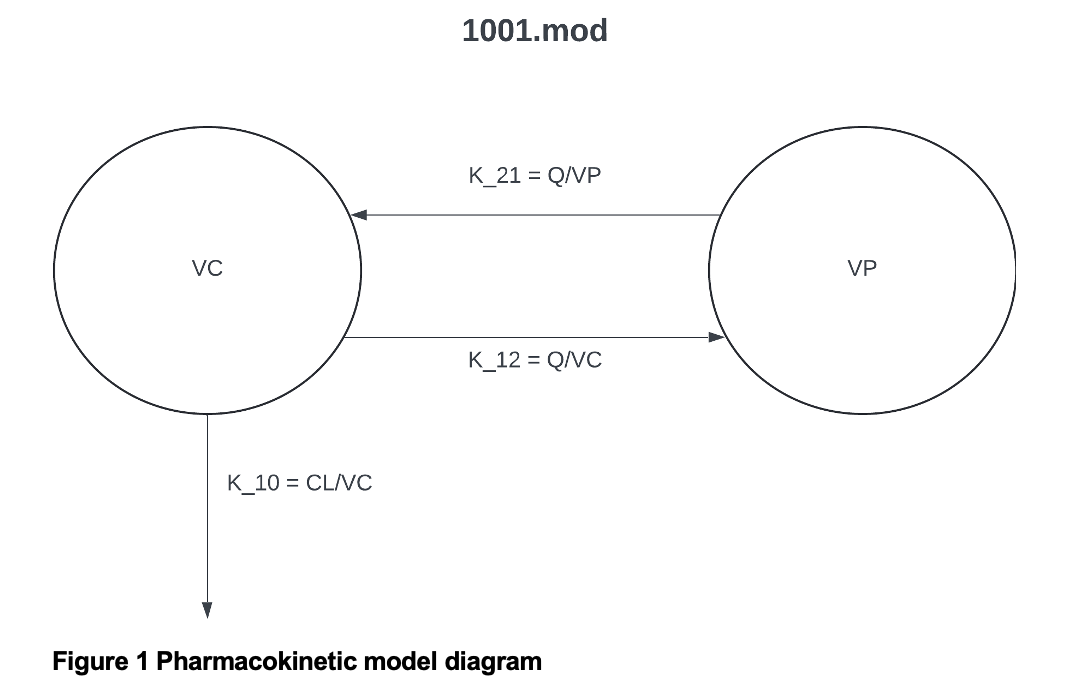
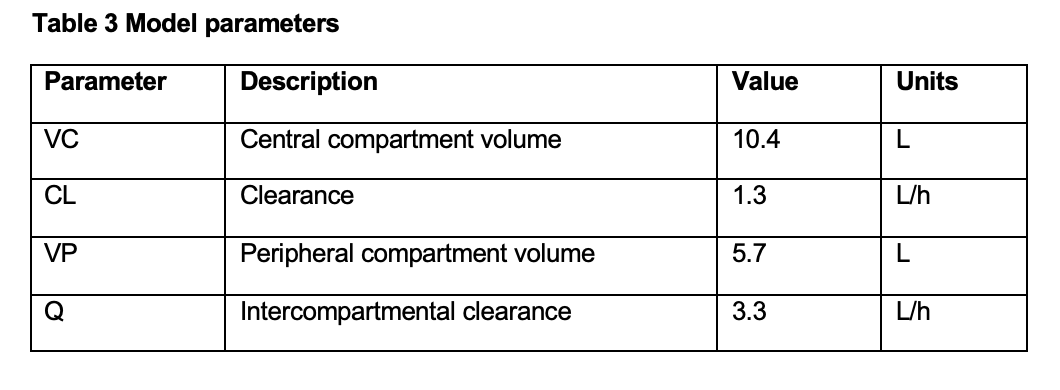
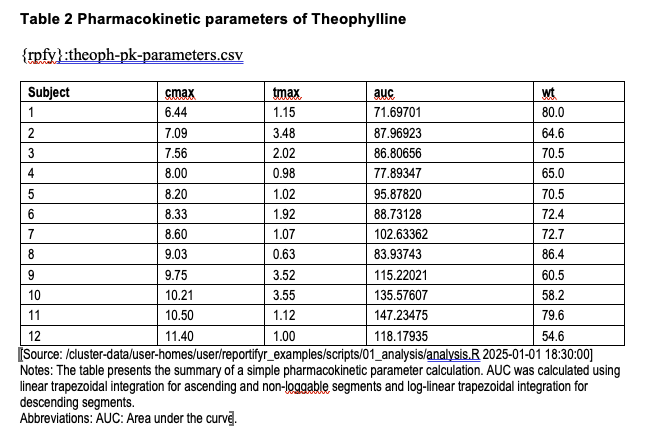
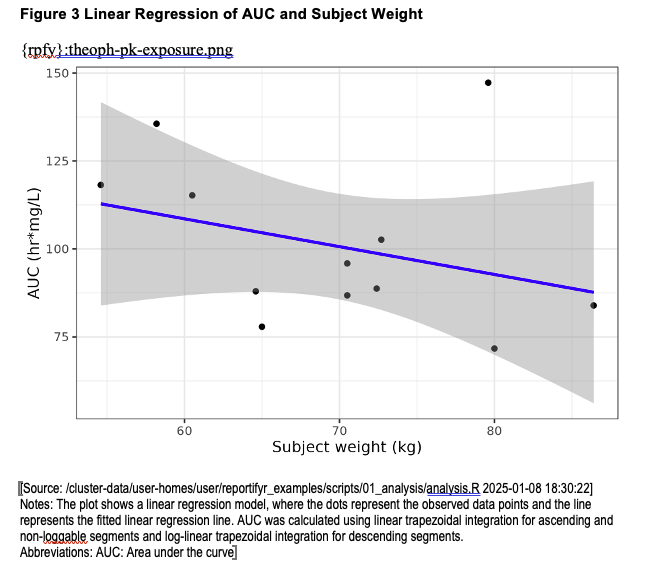
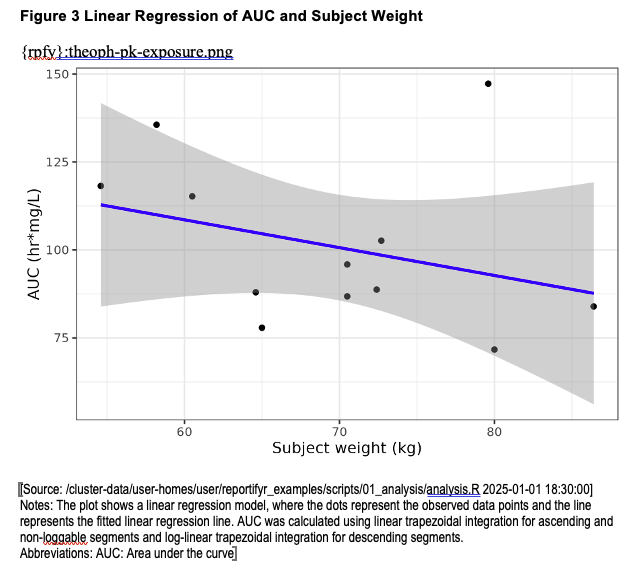
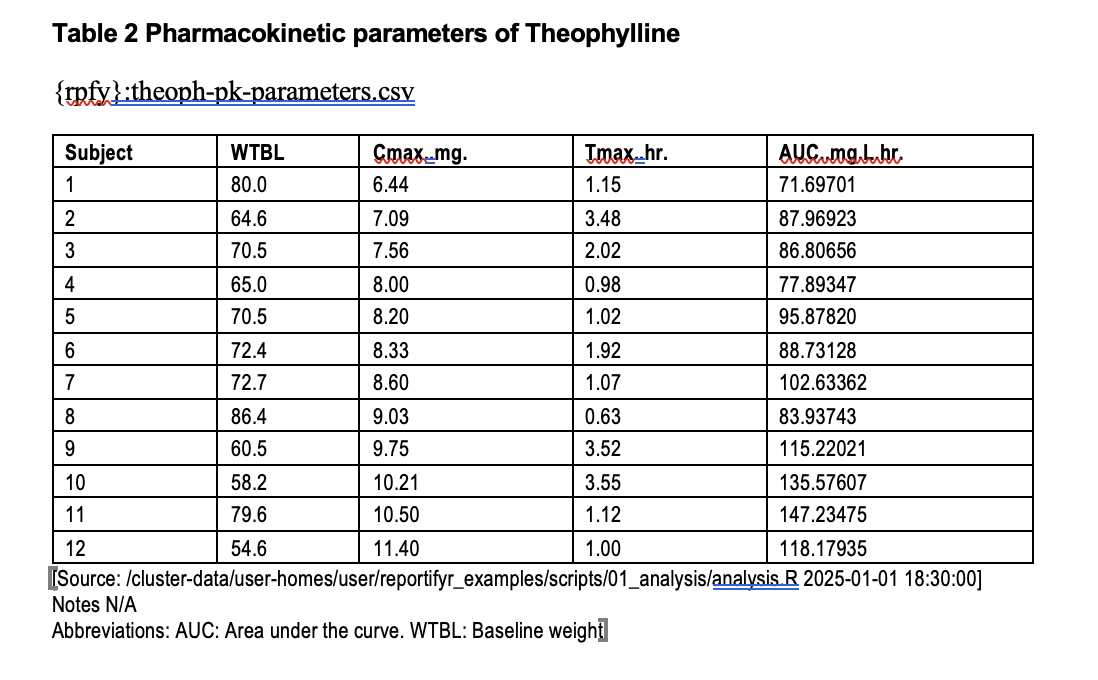
The example draft report includes the following figure and table, both previously generated in Performing Analyses:
Updating a Report
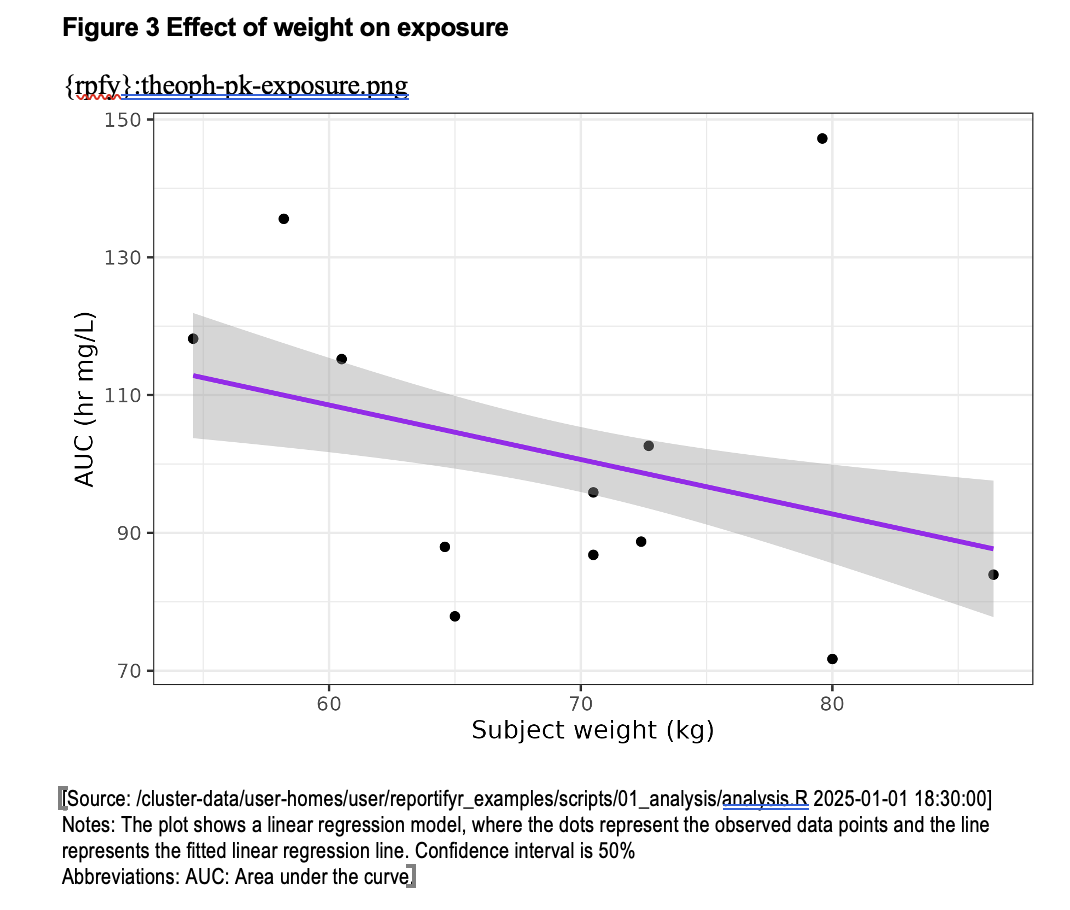
Now, let’s re-run a portion of the analysis where we update figure 3 and table 2:
library(reportifyr)library(ggplot2)library(dplyr)
data <- Theoph
meta_type <- get_meta_type(here::here("report", "standard_footnotes.yaml"))meta_abbrevs <- get_meta_abbrevs(here::here("report", "standard_footnotes.yaml"))
figures_path <- here::here("OUTPUTS", "figures")tables_path <- here::here("OUTPUTS", "tables")
calc_auc_linear_log <- function(time, conc) {  auc <- 0
  cmax_index <- which.max(conc)
  for (i in 1:(length(time) - 1)) {    delta_t <- time[i + 1] - time[i]
    if (i < cmax_index) {
      auc <- auc + delta_t * (conc[i + 1] + conc[i]) / 2    } else if (i >= cmax_index && conc[i + 1] > 0 && conc[i] > 0) {
      auc <- auc + delta_t * (conc[i] - conc[i + 1]) / log(conc[i] / conc[i + 1])    } else {
      auc <- auc + delta_t * (conc[i + 1] + conc[i]) / 2    }  }
  return(auc)}
pk_params <- data %>%  mutate(Subject = as.numeric(Subject)) %>%  group_by(Subject) %>%  summarise(    WTBL = Wt %>% unique(),    `Cmax (mg)` = max(conc, na.rm = TRUE),    `Tmax (hr)` = Time[which.max(conc)],    `AUC (mg/L hr)` = calc_auc_linear_log(Time, conc)  )
lr <- pk_params %>%  ggplot(aes(x = WTBL, y = `AUC (mg/L hr)`)) +  geom_point() +  geom_smooth(method = "lm", formula = y ~ x, se = TRUE, color = "purple", level = 0.5) +  theme_bw() +  labs(x = "Subject weight (kg)", y = "AUC (hr mg/L)")
plot_file_name <- "theoph-pk-exposure.png"
ggsave_with_metadata(  filename = file.path(figures_path, plot_file_name),  plot = lr,  meta_type = meta_type$`linear-regression-plot`,  meta_notes = "Confidence interval is 50%",  meta_abbrevs = c(meta_abbrevs$AUC),  width = 6,  height = 4)
outfile_name <- "theoph-pk-parameters.csv"
write_csv_with_metadata(  object = pk_params,  file = file.path(tables_path, outfile_name),  meta_abbrevs = c(meta_abbrevs$AUC, meta_abbrevs$WTBL),  row.names = FALSE)
After re-running analysis, we can simply call build_report() again to update
the report:
docx_old <- here::here("report", "draft", "template-draft.docx")docx_out <- here::here("report", "draft", "template-draft-v2.docx")
standard_footnotes_yaml <- here::here("report", "standard_footnotes.yaml")
build_report(  docx_in = docx_old,  docx_out = docx_out,  figures_path = figures_path,  tables_path = tables_path,  standard_footnotes_yaml = standard_footnotes_yaml,  add_footnotes = TRUE,  include_object_path = FALSE,  footnotes_fail_on_missing_metadata = TRUE)
We can see that figure 3 and table 2 were updated:

We can also see that non-reportifyr artifacts are left unmodified, as shown by
figure 1 and table 3: