reportifyr New User Guide
Welcome to the reportifyr New User Guide!
Getting Started with reportifyr
Are you ready to write your first report draft with reportifyr?
Please follow this step-by-step guide to get started:
Step 1
Run the following to load reportifyr:
library(reportifyr)Step 2
Next, initialize a report project at the project root directory by running:
initialize_report_project(project_dir = here::here())Step 3
Run the following to retrieve meta_abbrevs and meta_type parameters to standardize
footnotes:
meta_abbrevs <- get_meta_abbrevs(path_to_footnotes_yaml = here::here("report", "standard_footnotes.yaml"))meta_type <- get_meta_type(path_to_footnotes_yaml = here::here("report", "standard_footnotes.yaml"))Step 4
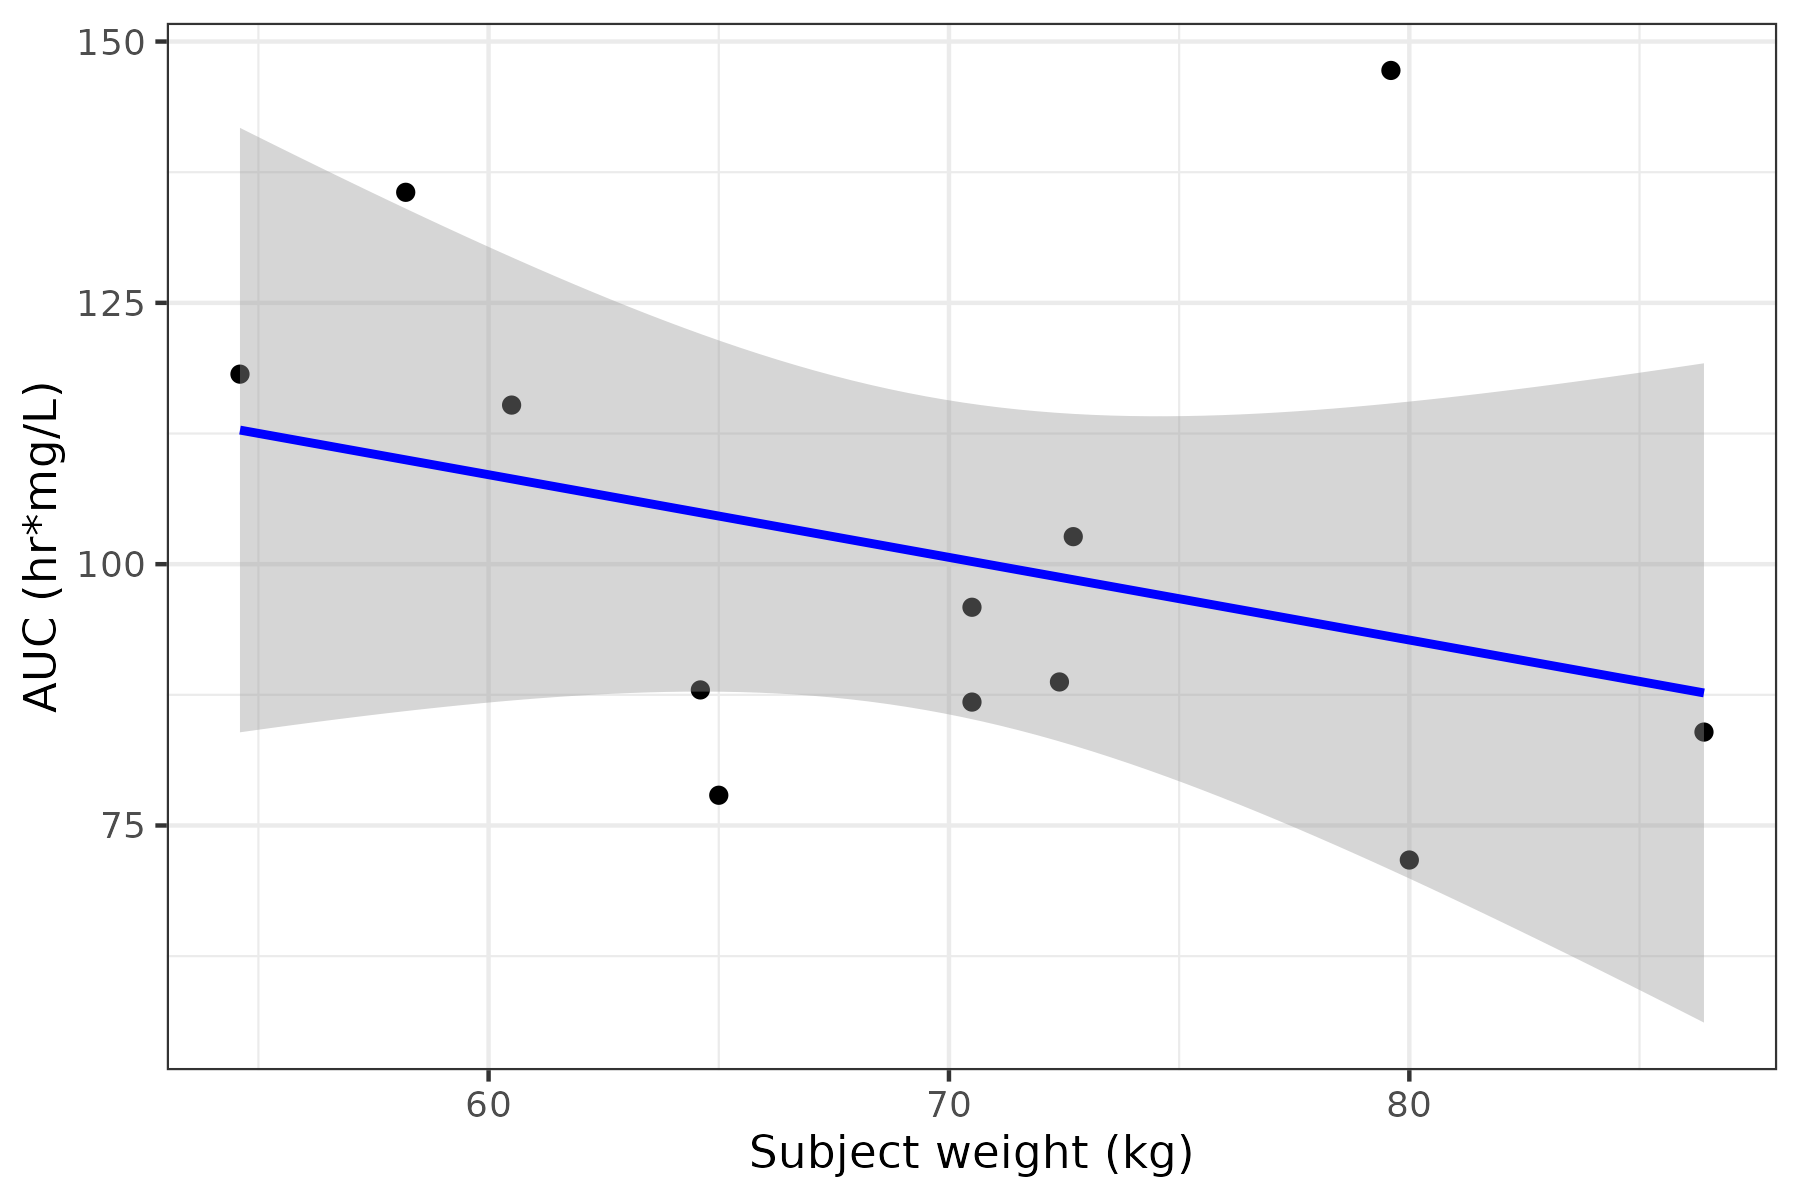
We can now run the following to generate a pharmacokinetic parameter summary table
and a linear regression of area under the concentration-time curve (AUC) vs.
subject weight:
library(dplyr)library(ggplot2)
data <- Theoph
calc_auc_linear_log <- function(time, conc) {  auc <- 0
  cmax_index <- which.max(conc)
  for (i in 1:(length(time) - 1)) {    delta_t <- time[i + 1] - time[i]
    if (i < cmax_index) {
      auc <- auc + delta_t * (conc[i + 1] + conc[i]) / 2    } else if (i >= cmax_index && conc[i + 1] > 0 && conc[i] > 0) {
      auc <- auc + delta_t * (conc[i] - conc[i + 1]) / log(conc[i] / conc[i + 1])    } else {
      auc <- auc + delta_t * (conc[i + 1] + conc[i]) / 2    }  }
  return(auc)}
pk_params <- data %>%  mutate(Subject = as.numeric(Subject)) %>%  group_by(Subject) %>%  summarise(    cmax = max(conc, na.rm = TRUE),    tmax = Time[which.max(conc)],    auc = calc_auc_linear_log(Time, conc),    wt = Wt %>% unique()  )
lr <- pk_params %>%  ggplot(aes(x = wt, y = auc)) +  geom_point() +  geom_smooth(method = "lm", formula = y ~ x, se = TRUE, color = "blue") +  theme_bw() +  labs(x = "Subject weight (kg)", y = "AUC (hr*mg/L)")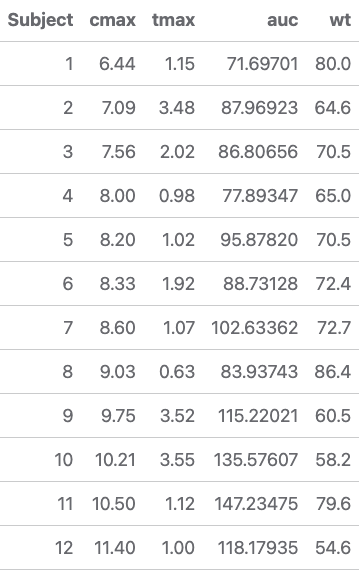
Step 5
Now run the following to save the table and plot to .csv and .png, respectively:
tables_path <- here::here("OUTPUTS", "tables")outfile_name <- "theoph-pk-parameters.csv"
write_csv_with_metadata(  object = pk_params,  file = file.path(tables_path, outfile_name),  meta_abbrevs = c(meta_abbrevs$AUC),  row.names = FALSE)
figures_path <- here::here("OUTPUTS", "figures")plot_file_name <- "theoph-pk-exposure.png"
ggsave_with_metadata(  filename = file.path(figures_path, plot_file_name),  meta_abbrevs = c(meta_abbrevs$AUC),  meta_type = meta_type$`linear-regression-plot`,  plot = lr,  height = 4,  width = 6)
Step 6
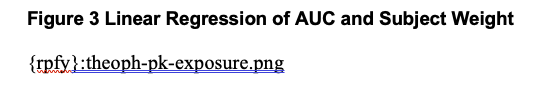
Ensure that initial document requirements are satisified before uploading to the appropriate directory:
- each figure or table (artifact) has a caption
- each caption is accompanied by a
reportifyrmagic string
As depicted here:
Step 7
Run the following to build a report:
docx_in <- here::here("report", "shell", "template.docx")docx_out <- here::here("report", "draft", "template-draft.docx")tables_path <- here::here("OUTPUTS", "tables")figures_path <- here::here("OUTPUTS", "figures")standard_footnotes_yaml <- here::here("report", "standard_footnotes.yaml")
build_report(  docx_in = docx_in,  docx_out = docx_out,  figures_path = figures_path,  tables_path = tables_path,  standard_footnotes_yaml = standard_footnotes_yaml)
Step 8
Lastly, run the following to finalize the document:
finalize_document( docx_in = here::here("report", "draft", "template-draft.docx"), docx_out = here::here("report", "final", "template-final.docx"))An important note, this step-by-step guide is an abbreviated form of the guides on Initializing Reportifyr, Performing Analyses, and Drafting Reports.