Elective Footnotes
Electing for No Footnotes
There are certain situations where footnotes might not be desired on all figures/tables
(artifacts), or even a few, within a given Microsoft Word document (report).
reportifyr supports this behavior through arguments to the build_report() function.
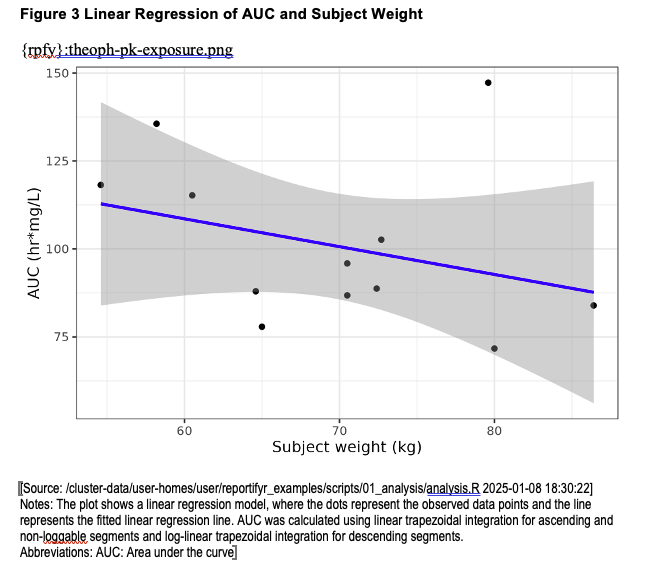
First, we’ll build a report that contains no footnotes using the template.docx
provided in Drafting Reports. To do this,
we can set the add_footnotes argument to FALSE, instead of its default TRUE:
library(reportifyr)
docx_shell <- here::here("report", "shell", "template.docx")doc_dirs <- make_doc_dirs(docx_in = docx_shell)
figures_path  <- here::here("OUTPUTS", "figures")tables_path <- here::here("OUTPUTS", "tables")standard_footnotes_yaml <- here::here("report", "standard_footnotes.yaml")
build_report(  docx_in = doc_dirs$doc_in,  docx_out = doc_dirs$doc_draft,  figures_path = figures_path,  tables_path = tables_path,  standard_footnotes_yaml = standard_footnotes_yaml,  add_footnotes = FALSE,  include_object_path = FALSE,  footnotes_fail_on_missing_metadata = TRUE)
This produces a report without any footnotes:
Elective Footnotes
This time around, let’s say we want to include an appendix artifact with no footnotes, but
we want footnotes within the rest of the report. We can use the footnotes_fail_on_missing_metadata
argument to achieve this. As footnotes are stored in the metadata .json file,
an artifact with no metadata would usually return an error. By setting footnotes_fail_on_missing_metadata = FALSE,
‘reportifyr’ now returns a warning instead of an error in the log messages and
the insertion of the artifact’s footnotes is skipped.
An important note, table formatting is stored within the metadata via the
table1_format field. This is an additional argument that is passed to the
format_flextable() function during add_tables(). In this case, the table that
we are electing to have no footnotes for will not have a metadata file. reportifyr
handles this in two approaches:
-
If the
.RDSfile contains a flextable object, formatting is retained. However, if the.RDSfile does not contain a flextable object, the object is formatted usingformat_flextable()with default arguments. -
Similarly, all
.csvfiles are formatted usingformat_flextable()with default arguments.
From here, let’s create another figure and table to add to the artifacts generated from Performing Analyses:
library(ggplot2)library(dplyr)
set.seed(123)
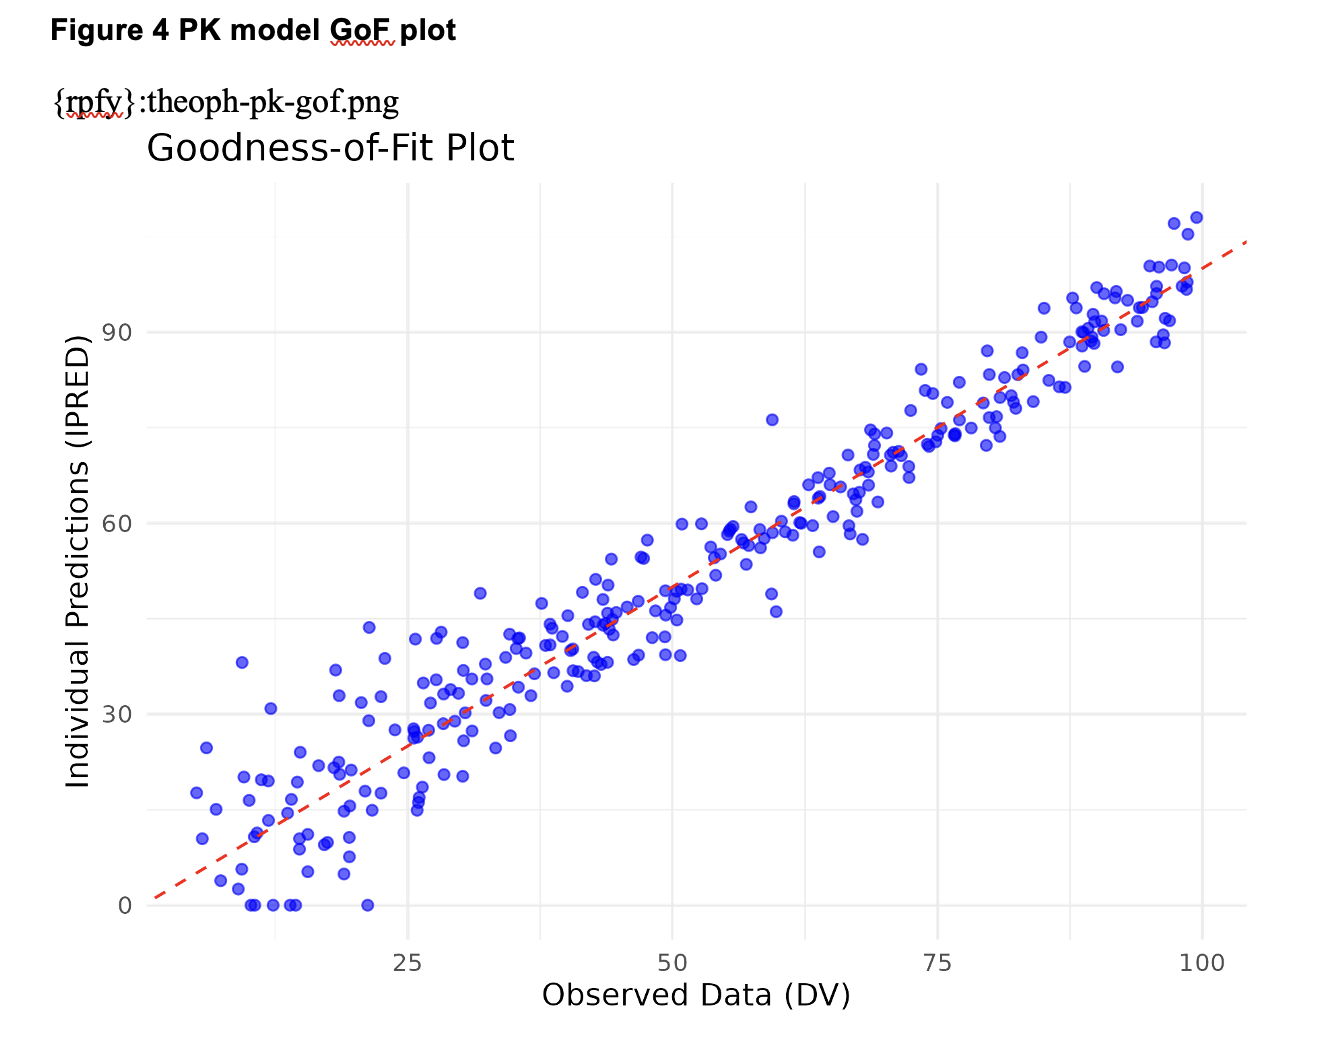
n <- 300DV <- runif(n, min = 5, max = 100)IPRED <- pmax(0, DV + rnorm(n, mean = 0, sd = 40 / sqrt(DV)))
gof_plot <- ggplot(data = data.frame(IPRED, DV), aes(x = DV, y = IPRED)) + geom_point(color = "blue", alpha = 0.6) + geom_abline(slope = 1, intercept = 0, color = "red", linetype = "dashed") + labs( title = "Goodness-of-Fit Plot", x = "Observed Data (DV)", y = "Individual Predictions (IPRED)" ) + theme_minimal()
gof_fig_name <- "theoph-pk-gof.png"
ggsave( filename = file.path(figures_path, gof_fig_name), plot = gof_plot, width = 6, height = 4.5)
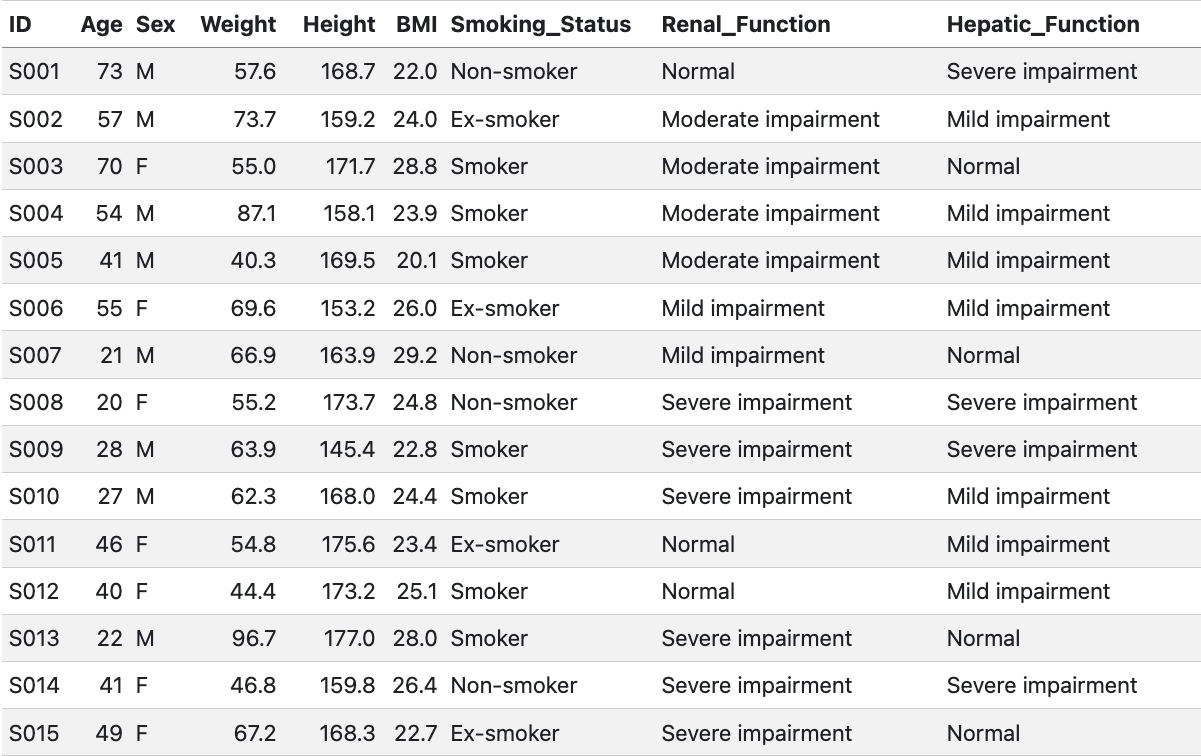
subjects <- 15
pk_demo <- data.frame( ID = sprintf("S%03d", 1:subjects), Age = sample(18:80, subjects, replace = TRUE), Sex = sample(c("M", "F"), subjects, replace = TRUE), Weight = round(rnorm(subjects, mean = 70, sd = 15), 1), Height = round(rnorm(subjects, mean = 170, sd = 10), 1), BMI = round(rnorm(subjects, mean = 25, sd = 4), 1), Smoking_Status = sample(c("Non-smoker", "Smoker", "Ex-smoker"), subjects, replace = TRUE), Renal_Function = sample(c("Normal", "Mild impairment", "Moderate impairment", "Severe impairment"), subjects, replace = TRUE), Hepatic_Function = sample(c("Normal", "Mild impairment", "Severe impairment"), subjects, replace = TRUE))
table_file <- "theoph-pk-demographics.csv"
utils::write.csv( pk_demo, file = file.path(tables_path, table_file), row.names = FALSE)
knitr::kable(pk_demo)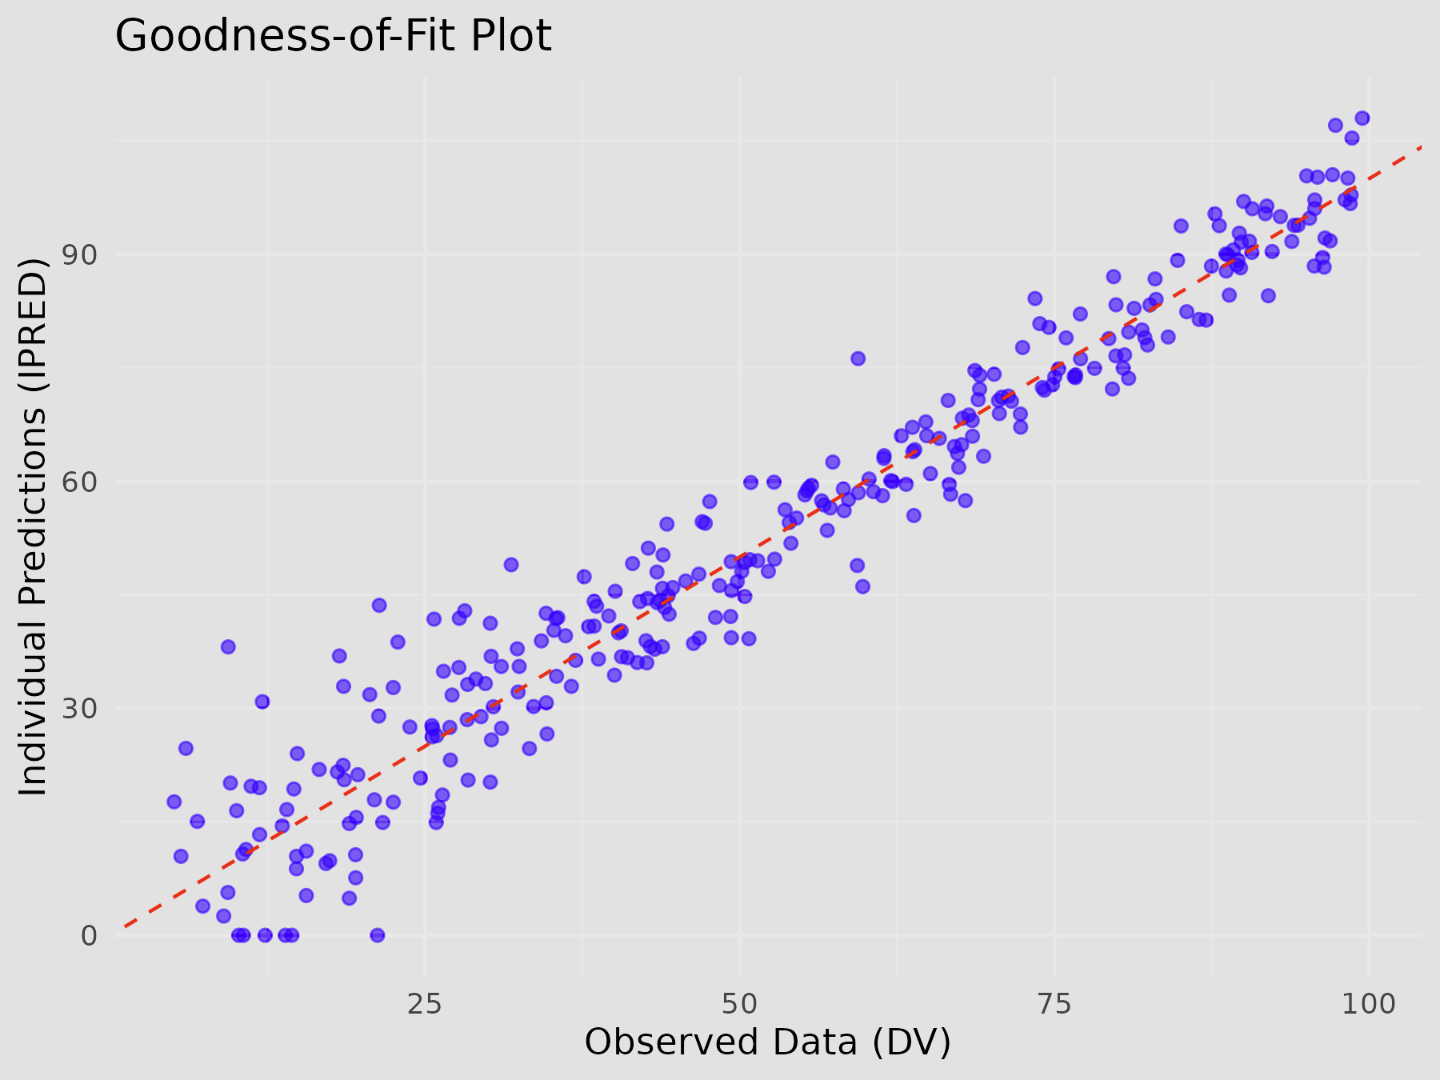
We will now use the template-ef.docx file
supplied by the reportifyr package, which contains captions and magic strings
in the appendices for our new artifacts, to build a report from:
docx_shell <- here::here("report", "shell", "template-ef.docx")doc_dirs <- make_doc_dirs(docx_in = docx_shell)
build_report(  docx_in = doc_dirs$doc_in,  docx_out = doc_dirs$doc_draft,  figures_path = figures_path,  tables_path = tables_path,  standard_footnotes_yaml = standard_footnotes_yaml,  add_footnotes = TRUE,  include_object_path = FALSE,  footnotes_fail_on_missing_metadata = FALSE)
Notice how the artifacts within the appendices do not have footnotes:

Yet, artifacts within the body of the report do have footnotes:
We can also see in the logs messaged to the console that theoph-pk-demographics.csv
was missing metadata, as was theoph-pk-gof.png, and that default formatting was
applied:
2025-02-13 19:55:08 [WARN] Metadata file missing for table: /cluster-data/user-homes/user/reportifyr_examples/OUTPUTS/tables/theoph-pk-demographics.csv2025-02-13 19:55:08 [WARN] Default formatting will be applied for /cluster-data/user-homes/user/reportifyr_examples/OUTPUTS/tables/theoph-pk-demographics.csv.0.995 sec elapsed0.18 sec elapsed2025-02-13 19:55:09 [WARN] Figure footnotes script stderr: Metadata file not found: /cluster-data/user-homes/user/reportifyr_examples/OUTPUTS/figures/theoph-pk-gof_png_metadata.json
2025-02-13 19:55:09 [WARN] Table footnotes script stderr: Metadata file not found: /cluster-data/user-homes/user/reportifyr_examples/OUTPUTS/tables/theoph-pk-demographics_csv_metadata.json
0.444 sec elapsed