Updating a reportifyr report
update_report.Rmd
options("venv_dir" = file.path(here::here(), "vignettes"))

library(reportifyr)
#> ── Set reportifyr options ──────────────────────────────────────────────────────
#> ✔ venv_dir: /home/runner/work/reportifyr/reportifyr/vignettes
#> ── Optional version options ────────────────────────────────────────────────────
#> ▇ options('uv.version') is not set. Default is 0.5.1
#> ▇ options('python.version') is not set. Default is system version
#> ▇ options('python-docx.version') is not set. Default is 1.1.2
#> ▇ options('pyyaml.version') is not set. Default is 6.0.2
initialize_report_project(file.path(here::here(), "vignettes"))
#> Creating python virtual environment with the following settings:
#>      venv_dir: /home/runner/work/reportifyr/reportifyr/vignettes
#>  python-docx.version: 1.1.2
#>  pyyaml.version: 6.0.2
#>  uv.version: 0.5.1
#>  python.version: 3.10.12
#> Copied standard_footnotes.yaml into /home/runner/work/reportifyr/reportifyr/vignettes/report
Below is a simple analysis of the Theophylline data set that we will include in the report:
library(ggplot2)
library(dplyr)
#>
#> Attaching package: 'dplyr'
#> The following objects are masked from 'package:stats':
#>
#>     filter, lag
#> The following objects are masked from 'package:base':
#>
#>     intersect, setdiff, setequal, union

result <- file.copy(from = system.file("extdata/template.docx", package = "reportifyr"),
                    to = file.path(here::here(), "vignettes", "report", "shell", "template.docx"))

data <- Theoph
p <- ggplot(data, aes(x = Time, y = conc, group = Subject)) +
  geom_point() +
  geom_line() +
  theme_bw() +
  labs(x = "Time (hr)", y = "Theophylline concentration (mg/L)")

meta_types = get_meta_type(file.path(here::here(), "vignettes", "report", "standard_footnotes.yaml"))

figures_path <- file.path(here::here(), "vignettes", "OUTPUTS", "figures")
meta_plot_file_name <- "theoph-pk-plot.png"

ggsave_with_metadata(
  filename = file.path(figures_path, meta_plot_file_name),
  meta_type = meta_types$`conc-time-trajectories`,
  width = 6,
  height = 3
)

calc_auc_linear_log <- function(time, conc) {
  auc <- 0

  cmax_index <- which.max(conc)

  for (i in 1:(length(time) - 1)) {
    delta_t <- time[i + 1] - time[i]

    if (i < cmax_index) {

      auc <- auc + delta_t * (conc[i + 1] + conc[i]) / 2
    } else if (i >= cmax_index && conc[i + 1] > 0 && conc[i] > 0) {

      auc <- auc + delta_t * (conc[i] - conc[i + 1]) / log(conc[i] / conc[i + 1])
    } else {

      auc <- auc + delta_t * (conc[i + 1] + conc[i]) / 2
    }
  }

  return(auc)
}

pk_params <- data %>%
  mutate(Subject = as.numeric(Subject)) %>%
  group_by(Subject) %>%
  summarise(
    cmax = max(conc, na.rm = TRUE),
    tmax = Time[which.max(conc)],
    auc = calc_auc_linear_log(Time, conc),
    wt = Wt %>% unique()
  )

lr <- pk_params %>%
  ggplot(aes(x = wt, y = auc)) +
  geom_point() +
  geom_smooth(method = "lm", formula = y ~ x, se = TRUE, color = "blue") +
  theme_bw() +
  labs(x = "Subject weight (kg)", y = "AUC (hr mg/L)")

plot_file_name <- "theoph-pk-exposure.png"
ggsave_with_metadata(
  filename = file.path(figures_path, plot_file_name),
  meta_type = meta_types$`linear-regression-plot`,
  plot = lr,
  width = 6,
  height = 3
)

tables_path <- file.path(here::here(), "vignettes", "OUTPUTS", "tables")
outfile_name <- "theoph-pk-parameters.csv"

write_csv_with_metadata(
  pk_params,
  file = file.path(tables_path, outfile_name),
  row.names = FALSE
)

data_outfile_name <- "theoph-pk-data.RDS"
save_rds_with_metadata(data, file = file.path(tables_path, data_outfile_name))
# Specify input and output .docx files
docx_shell <- file.path(here::here(), "vignettes", "report", "shell", "template.docx")
docx_out <- file.path(here::here(), "vignettes", "report", "draft", "draft_v1.docx")

# Specify paths to tables and figures directories and the standard_footnotes yaml
tables_path <- file.path(here::here(), "vignettes", "OUTPUTS", "tables")
figures_path <- file.path(here::here(), "vignettes", "OUTPUTS", "figures")
footnotes <- file.path(here::here(), "vignettes", "report", "standard_footnotes.yaml")

build_report(docx_in = docx_shell,
             docx_out = docx_out,
             figures_path = figures_path,
             tables_path = tables_path,
             standard_footnotes_yaml = footnotes)
#> 1.591 sec elapsed
#> 0.202 sec elapsed
#> 0.497 sec elapsed
We’ll start with a reportifyr document that has figures,
tables, and footnotes that need to be updated. Let’s run another
analysis where we update figures 2 and 3, and table 2:
library(ggplot2)
library(dplyr)

result <- file.copy(from = system.file("extdata/template.docx", package = "reportifyr"),
                    to = file.path(here::here(), "vignettes", "report", "shell", "template.docx"))

data <- Theoph
p <- ggplot(data, aes(x = Time, y = conc, group = Subject, color = Subject)) +
  geom_line() +
  theme_bw() +
  labs(x = "Time (hr)", y = "Theophylline concentration (mg/L)")

meta_types = get_meta_type(file.path(here::here(), "vignettes", "report", "standard_footnotes.yaml"))
meta_abbrevs = get_meta_abbrevs(file.path(here::here(), "vignettes", "report", "standard_footnotes.yaml"))

figures_path <- file.path(here::here(), "vignettes", "OUTPUTS", "figures")
meta_plot_file_name <- "theoph-pk-plot.png"

ggsave_with_metadata(
  filename = file.path(figures_path, meta_plot_file_name),
  meta_type = meta_types$`conc-time-trajectories`,
  width = 6,
  height = 3,
)
update_object_footnotes(file.path(figures_path, meta_plot_file_name), notes = "Trajectories are colored by subject")
#> Footnotes successfully updated in /home/runner/work/reportifyr/reportifyr/vignettes/OUTPUTS/figures/theoph-pk-plot_png_metadata.json

calc_auc_linear_log <- function(time, conc) {
  auc <- 0

  cmax_index <- which.max(conc)

  for (i in 1:(length(time) - 1)) {
    delta_t <- time[i + 1] - time[i]

    if (i < cmax_index) {

      auc <- auc + delta_t * (conc[i + 1] + conc[i]) / 2
    } else if (i >= cmax_index && conc[i + 1] > 0 && conc[i] > 0) {

      auc <- auc + delta_t * (conc[i] - conc[i + 1]) / log(conc[i] / conc[i + 1])
    } else {

      auc <- auc + delta_t * (conc[i + 1] + conc[i]) / 2
    }
  }

  return(auc)
}

pk_params <- data %>%
  mutate(Subject = as.numeric(Subject)) %>%
  group_by(Subject) %>%
  summarise(
    WTBL = Wt %>% unique(),
    `Cmax (mg)` = max(conc, na.rm = TRUE),
    `Tmax (hr)` = Time[which.max(conc)],
    `AUC (mg/L hr)` = calc_auc_linear_log(Time, conc)
  )

lr <- pk_params %>%
  ggplot(aes(x = WTBL, y = `AUC (mg/L hr)`)) +
  geom_point() +
  geom_smooth(method = "lm", formula = y ~ x, se = TRUE, color = "purple", level = 0.5) +
  theme_bw() +
  labs(x = "Subject weight (kg)", y = "AUC (hr mg/L)")

plot_file_name <- "theoph-pk-exposure.png"
ggsave_with_metadata(
  filename = file.path(figures_path, plot_file_name),
  meta_type = meta_types$`linear-regression-plot`,
  plot = lr,
  width = 6,
  height = 3
)
update_object_footnotes(file.path(figures_path, plot_file_name),notes = "Confidence interval is 50%",  abbrevs = meta_abbrevs$AUC)
#> Footnotes successfully updated in /home/runner/work/reportifyr/reportifyr/vignettes/OUTPUTS/figures/theoph-pk-exposure_png_metadata.json
tables_path <- file.path(here::here(), "vignettes", "OUTPUTS", "tables")
outfile_name <- "theoph-pk-parameters.csv"

write_csv_with_metadata(
  pk_params,
  file = file.path(tables_path, outfile_name),
  row.names = FALSE,
  meta_type = meta_types$covariate_descriptive,
  meta_abbrevs = meta_abbrevs$WTBL
)

data_outfile_name <- "theoph-pk-data.RDS"
save_rds_with_metadata(data, file = file.path(tables_path, data_outfile_name))
After running the new analysis, we can simply recall
build_report again to update the document:
# Specify input and output .docx files
docx_old <- file.path(here::here(), "vignettes", "report", "draft", "draft_v1.docx")
docx_out <- file.path(here::here(), "vignettes", "report", "draft", "draft_v2.docx")

# Specify paths to tables and figures directories and the standard_footnotes.yaml
tables_path <- file.path(here::here(), "vignettes", "OUTPUTS", "tables")
figures_path <- file.path(here::here(), "vignettes", "OUTPUTS", "figures")
footnotes <- file.path(here::here(), "vignettes", "report", "standard_footnotes.yaml")

build_report(docx_in = docx_old,
             docx_out = docx_out,
             figures_path = figures_path,
             tables_path = tables_path,
             standard_footnotes_yaml = footnotes)
#> 1.506 sec elapsed
#> 0.22 sec elapsed
#> 0.504 sec elapsed
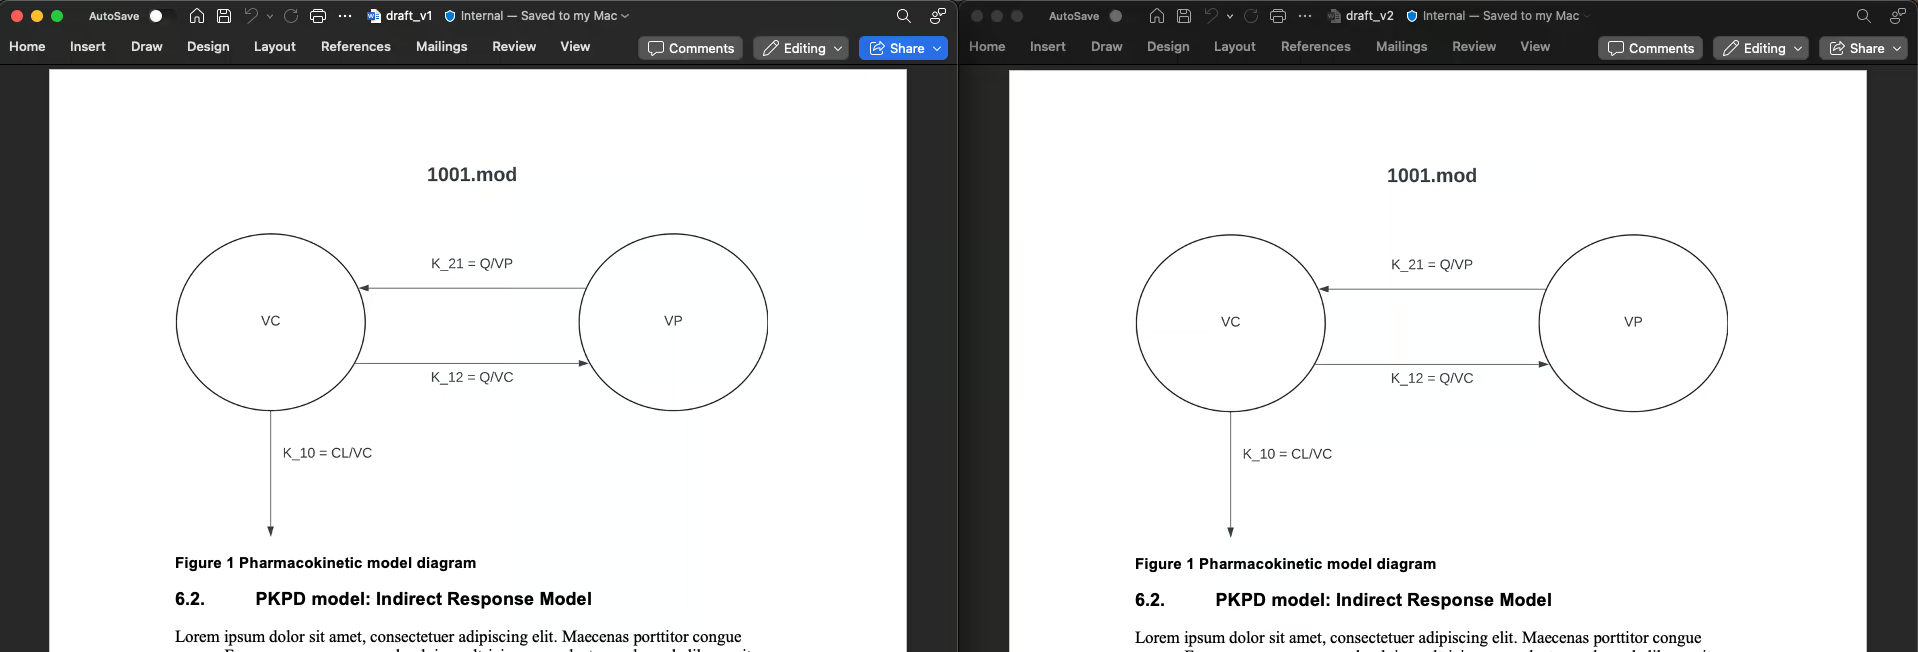
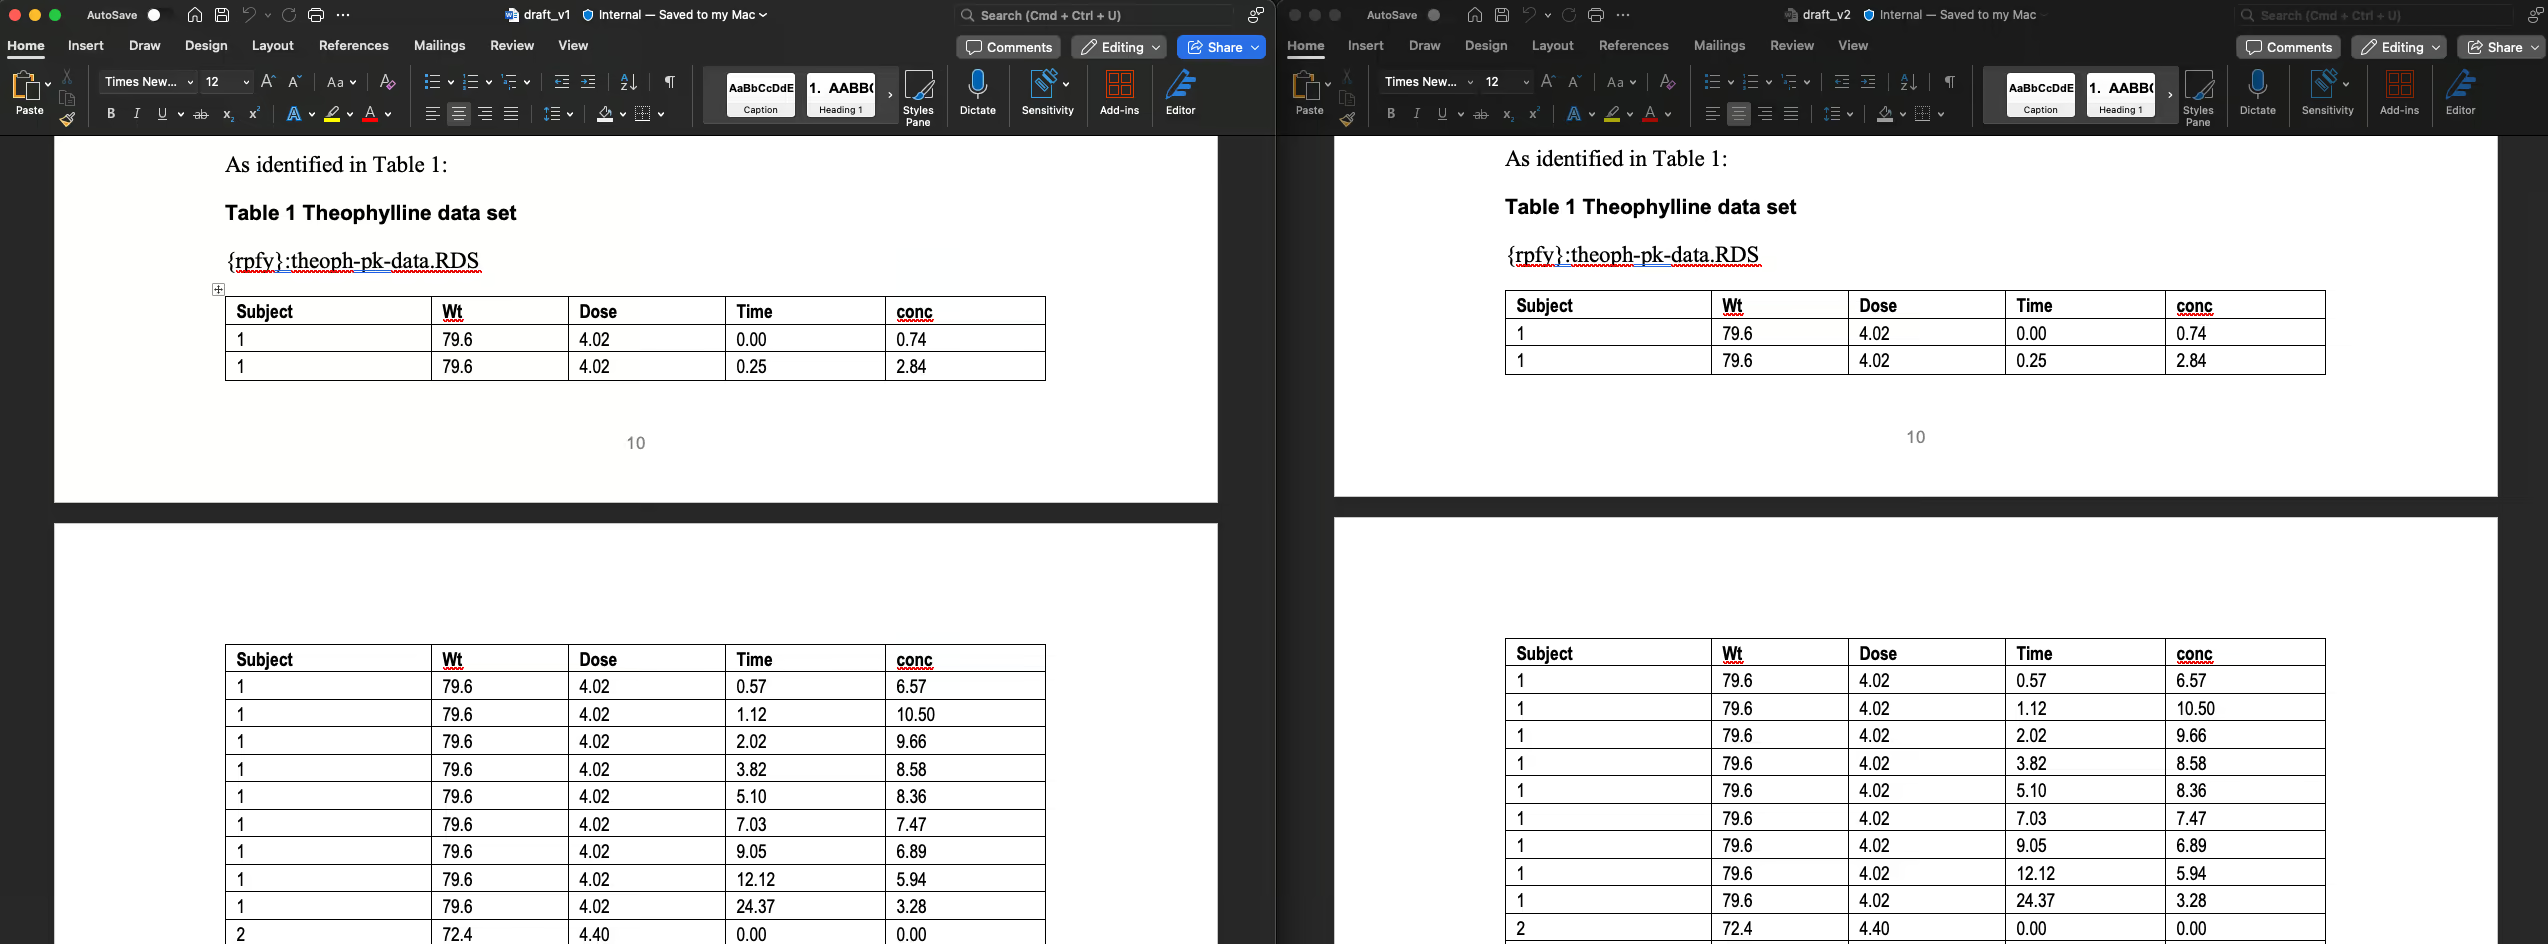
We can see that figures 2 and 3 were updated, and table 2 was
updated, while table 1 and the non-reportifyr content were
unaltered:

Figure 1 is unaltered

Figure 2 is updated

Figure 3 is updated

Table 1 is unaltered

Table 2 is updated

Table 3 is unaltered