Integrating reportifyr into report writing
Integrating_reportifyr_into_report_writing.Rmd
library(reportifyr)
#> ── Needed reportifyr options ───────────────────────────────────────────────────
#> ✖ options('venv_dir') is not set. venv will be created in Project root
#> ℹ Please set all options for package to work.
#> ── Optional version options ────────────────────────────────────────────────────
#> ▇ options('uv.version') is not set. Default is 0.5.1
#> ▇ options('python.version') is not set. Default is system version
#> ▇ options('python-docx.version') is not set. Default is 1.1.2
#> ▇ options('pyyaml.version') is not set. Default is 6.0.2

options("venv_dir" = file.path(here::here(), "vignettes"))
initialize_report_project(file.path(here::here(), "vignettes"))
#> Creating python virtual environment with the following settings:
#>      venv_dir: /home/runner/work/reportifyr/reportifyr/vignettes
#>  python-docx.version: 1.1.2
#>  pyyaml.version: 6.0.2
#>  uv.version: 0.5.1
#>  python.version: 3.10.12
#> Copied standard_footnotes.yaml into /home/runner/work/reportifyr/reportifyr/vignettes/report
If you’d like more detail on the initialization of
reportifyr, please see the vignette on initializing
reportifyr.
To build reports with reportifyr you need to insert a
figure or table caption using the ‘Insert Caption’ button under the
‘References’ ribbon.

This will insert a caption (either figure or table) into the Microsoft Word document. Underneath that caption, you need to add:
{rpfy}:file_name_of_figure/table
This string triggers the magic behind reportifyr, and
inserts the figure or table correctly into the document. The
file_name_of_figure/table will need to be in the
appropriate ‘OUTPUTS/’ directory with the associated metadata file.
In the vignette
on integrating reportifyr into analyses, we saved two figures and
two tables. In the template Microsoft Word document packaged with
reportifyr, figure and table captions, and their associated
magic strings to allow insertion of figures/tables and footnotes, have
already been inserted. Below is an image of the caption and magic string
for the concentration time profile figure we generated:

We can now perform some setup and start filling in the template! The
first thing we’ll do is assign the input and output document names. We
will be populating the template.docx which contains no
figures or tables inserted by reportifyr. If the input
document does contain reportifyr inserted objects, you’ll
need to remove them with remove_tables_figures_footnotes
first.
docx_shell <- file.path(here::here(), "vignettes", "report", "shell", "template.docx")
doc_dirs <- make_doc_dirs(docx_in = docx_shell)
The make_doc_dirs helper function creates several file
paths that are useful for this process:
doc_dirs
#> $doc_in
#> [1] "/home/runner/work/reportifyr/reportifyr/vignettes/report/shell/template.docx"
#>
#> $doc_clean
#> [1] "/home/runner/work/reportifyr/reportifyr/vignettes/report/draft/template-clean.docx"
#>
#> $doc_tables
#> [1] "/home/runner/work/reportifyr/reportifyr/vignettes/report/draft/template-tabs.docx"
#>
#> $doc_tabs_figs
#> [1] "/home/runner/work/reportifyr/reportifyr/vignettes/report/draft/template-tabsfigs.docx"
#>
#> $doc_draft
#> [1] "/home/runner/work/reportifyr/reportifyr/vignettes/report/draft/template-draft.docx"
#>
#> $doc_final
#> [1] "/home/runner/work/reportifyr/reportifyr/vignettes/report/final/template-final.docx"
If your shell contains reportifyr figures and tables, we
can clean those by running the following function:
remove_tables_figures_footnotes(docx_in = docx_shell,
                                docx_out = doc_dirs$doc_clean)
This will save a clean draft in the ‘report/draft’ directory ready for the next processing steps.
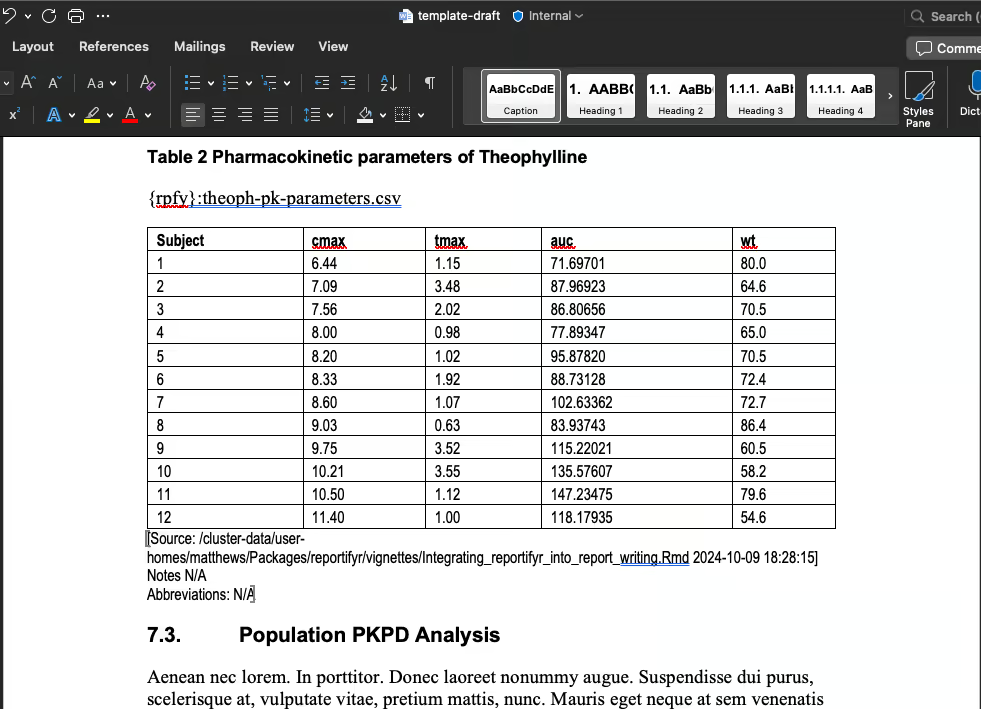
We start by inserting the tables
tables_path <- file.path(here::here(), "vignettes", "OUTPUTS", "tables")

add_tables(docx_in = doc_dirs$doc_clean,
           docx_out = doc_dirs$doc_tables,
           tables_path = tables_path)
#> 1.584 sec elapsed
We can see the tables were successfully inserted:
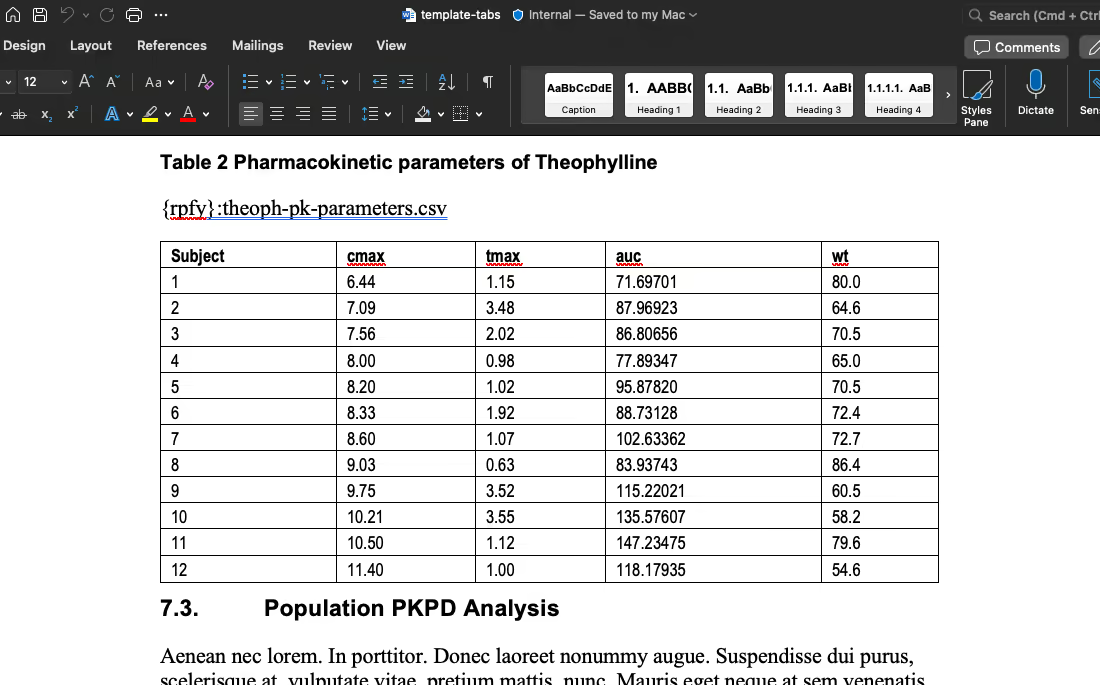
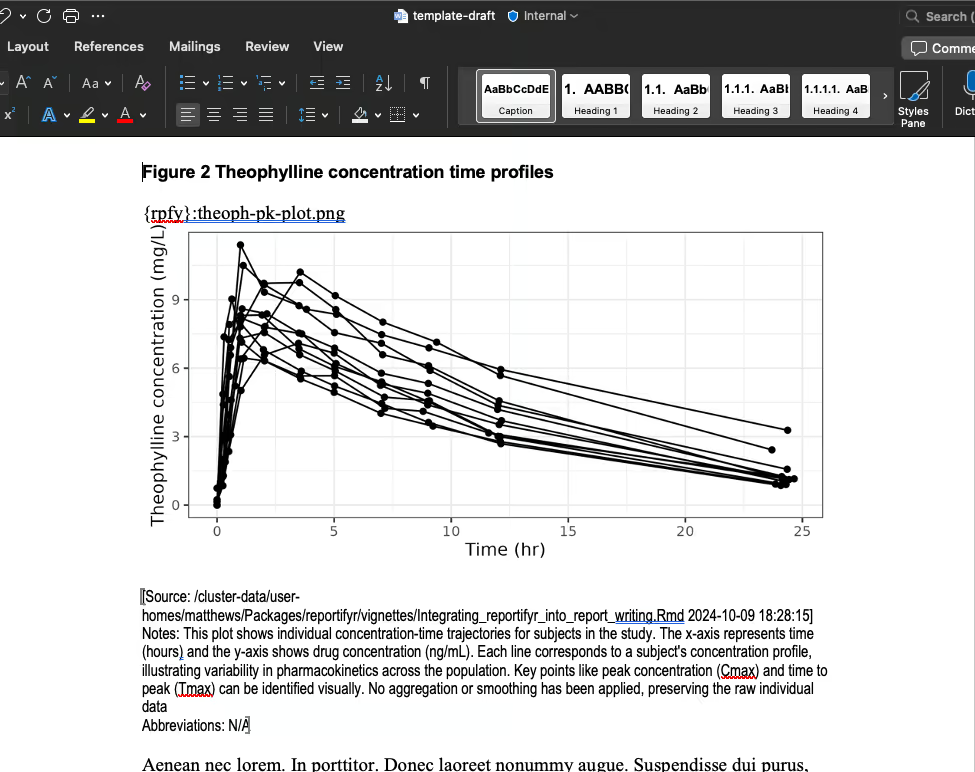
Now that the tables are inserted, we can insert the figures:
figures_path <- file.path(here::here(), "vignettes", "OUTPUTS", "figures")

add_plots(docx_in = doc_dirs$doc_tables,
          docx_out = doc_dirs$doc_tabs_figs,
          figures_path = figures_path)
#> 0.203 sec elapsed
And now we can see our figures in the document as well:
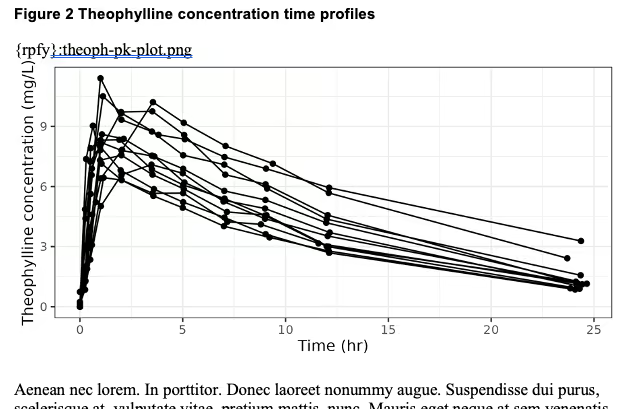
Now we can add the footnotes:
footnotes <- file.path(here::here(), "vignettes", "report", "standard_footnotes.yaml")

add_footnotes(docx_in = doc_dirs$doc_tabs_figs,
              docx_out = doc_dirs$doc_draft,
              figures_path = figures_path,
              tables_path = tables_path,
              footnotes = footnotes)
#> 0.496 sec elapsed
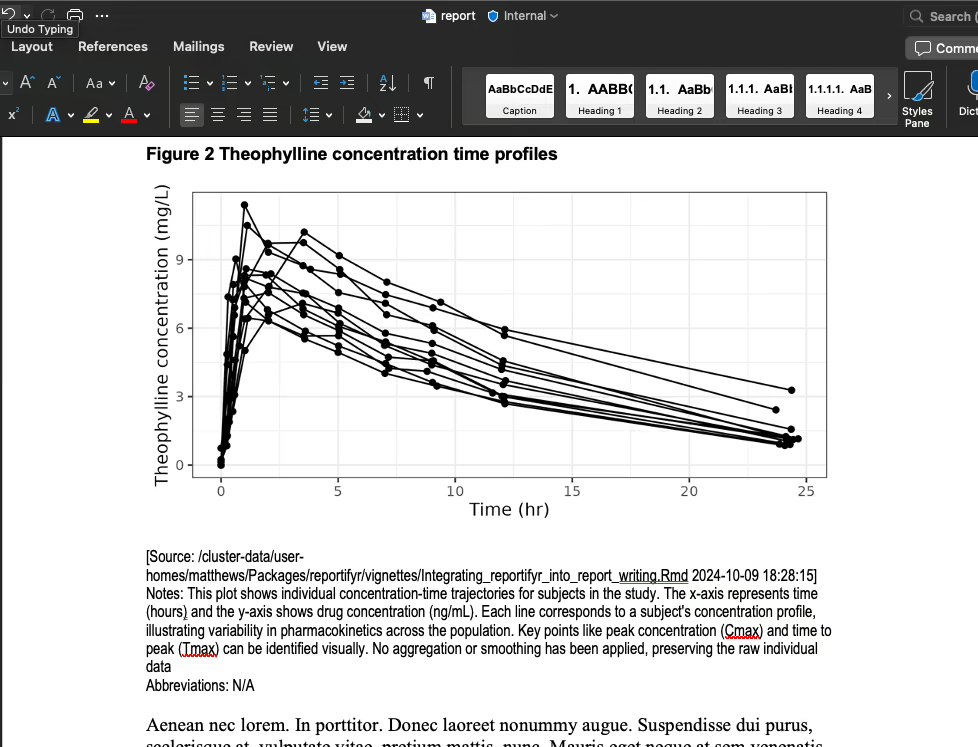
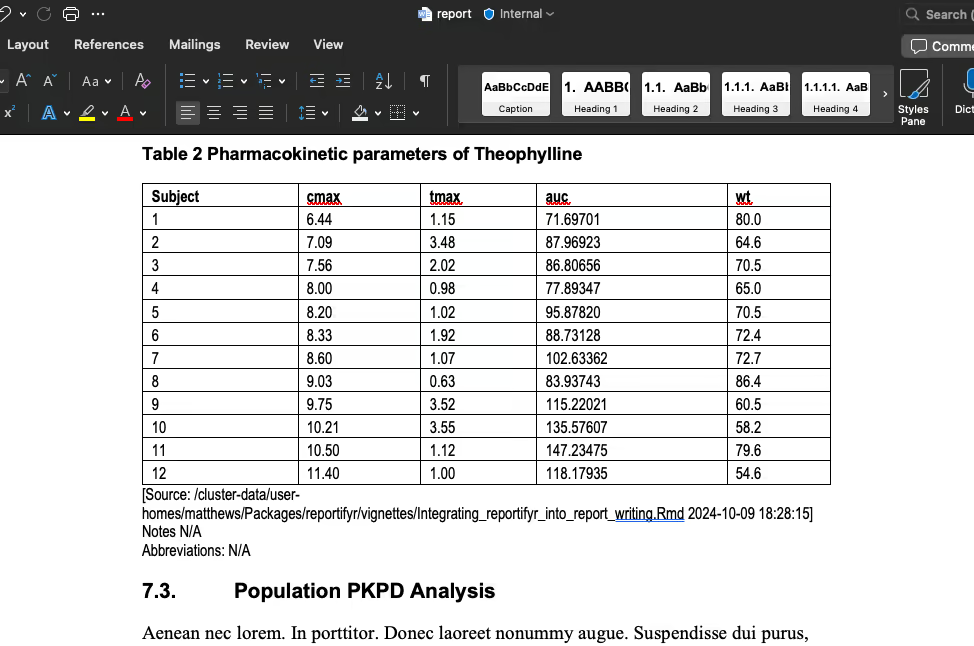
We now can see our figures and tables have footnotes inserted:
Now that all the elements are inserted, we can generate a clean final
report. This severs the link between reportifyr and the
document, so please be careful using this function:
final_report <- file.path(here::here(), "vignettes", "report", "final", "report.docx")

finalize_document(docx_in = doc_dirs$doc_draft,
                     docx_out = final_report)
This creates a finalized document, free of magic strings, while also capturing the metadata for this final document. The metadata includes a file hash so you can see if this document has been updated since its creation.
