style_plot
Description
Styles a plot with provided colors and labels
Usage
style_plot( p, title = NULL, xlabel = NULL, ylabel = NULL, xlims = NULL, ylims = NULL, colors = NULL, labels = NULL, shapes = NULL, legend = NULL, shape_legend = NULL, color_order = NULL, shape_order = NULL, linetype_order = NULL, legend.position = NULL, legend.title.position = NULL, legend.title.hjust = NULL, logx = NULL, logy = NULL, fill_alpha = NULL, fill_legend = NULL, fill_order = NULL, caption_hjust = NULL, legend_nrow = NULL)Arguments
| Name | Description |
|---|---|
p | a ggplot2 object to update colors/legend labels |
title | a string for a plot title |
xlabel | a string for x-axis label |
ylabel | a string for y-axis label |
xlims | a tuple of numbers specifying limits for x-axis |
ylims | a tuple of numbers specifying limits for y-axis |
colors | a named character vector for setting colors |
labels | a named character vector for setting legend labels |
shapes | a named character vector for setting geom_point shapes |
legend | a string for setting color legend title |
shape_legend | a string for setting shape legend title |
color_order | a numeric for setting color legend order |
shape_order | a numeric for setting shape legend order |
linetype_order | a numeric for setting linetype legend order |
legend.position | a string for legend position |
legend.title.position | a string for legend title position (“top”, “left”, “bottom”, “right”) |
legend.title.hjust | a string or numeric for legend title horizontal justification (“left”/0, “center”/0.5, “right”/1) |
logx | a boolean for setting x-axis to log scale |
logy | a boolean for setting y-axis to log scale |
fill_alpha | a numeric for controlling alpha of fill colors |
fill_legend | a string to replace fill legend title |
fill_order | a numeric for setting fill legend order |
caption_hjust | a string or numeric for caption horizontal justification (“left”/0, “center”/0.5, “right”/1) |
legend_nrow | a numeric for number of rows in legend |
Returns
an updated ggplot2 object
Examples
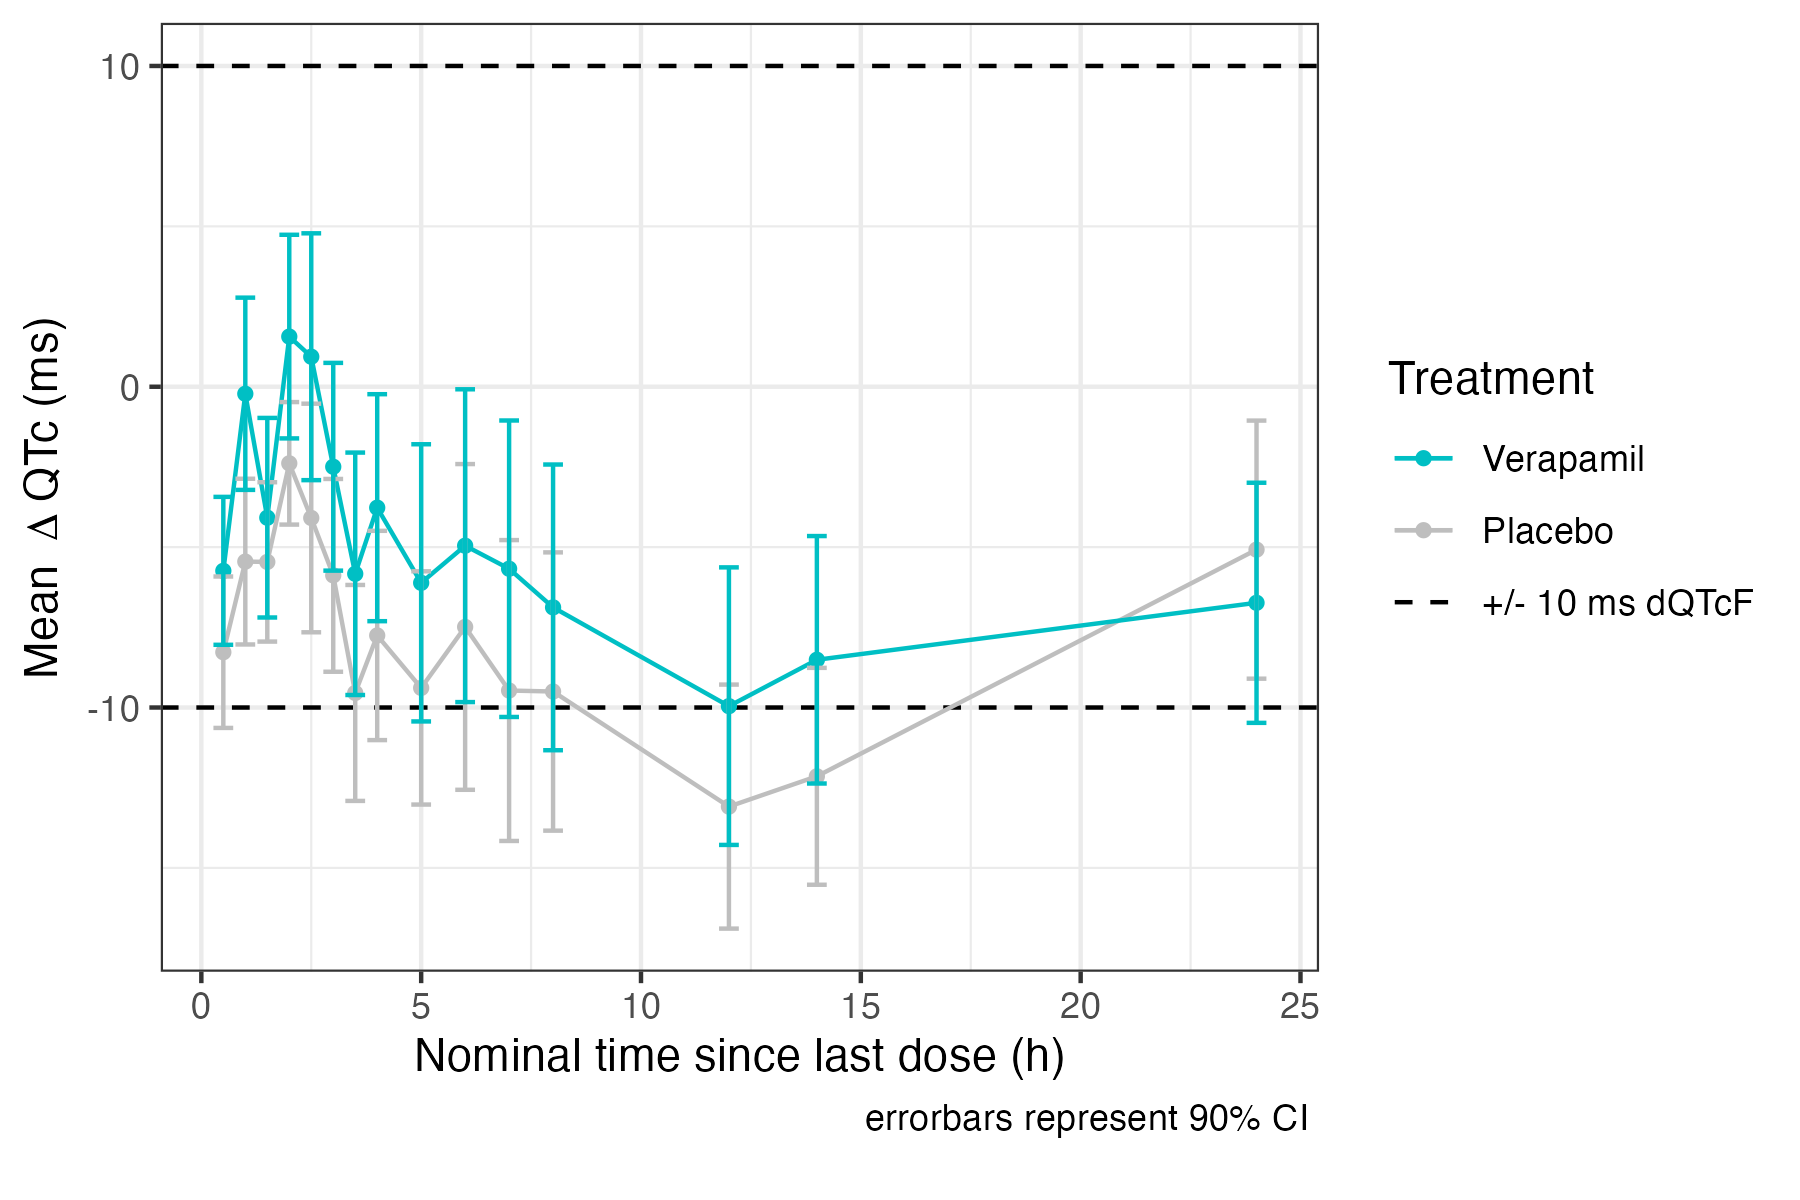
data_proc <- data |> preprocess() .p <- eda_mean_dv_over_time(   data_proc,   deltaQTCF,   NTLD,   DOSEF,   group_col = TRTG,   reference_threshold = c(-10, 10), )
 .p <- style_plot(   p = .p,   colors = c(     "0 mg Placebo" = "grey"   ),   labels = c(     "120 mg Verapamil HCL" = "Verapamil",     "0 mg Placebo" = "Placebo",     "Reference 10" = "+/- 10 ms dQTcF",     "Reference -10" = NA   ),   legend = "Treatment" ) .p