predict_with_exposure_plot
Description
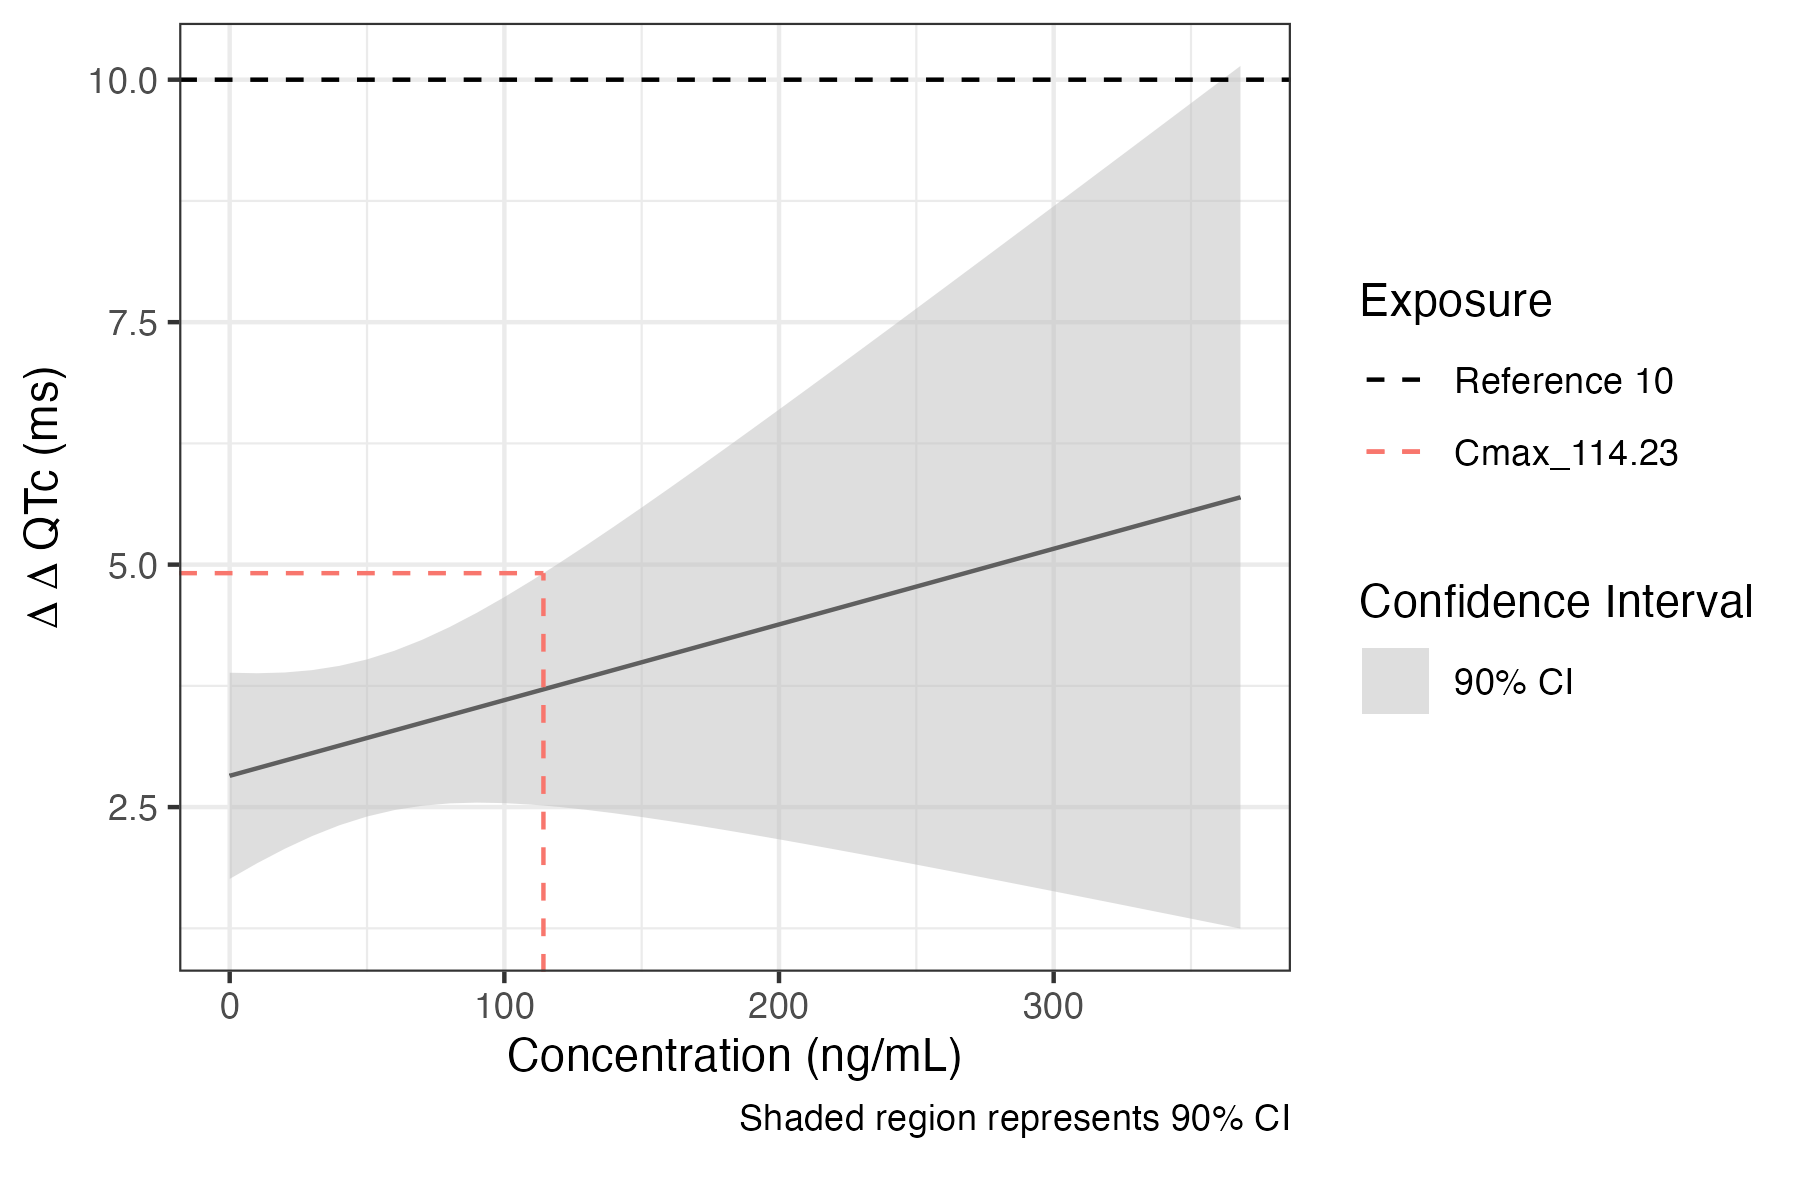
Plots model predictions with therapeutic and supra therapeutic Cmax
Usage
predict_with_exposure_plot( data, fit, conc_col, treatment_predictors, control_predictors = NULL, reference_threshold = c( 10), cmaxes = NULL, conf_int = 0.9, style = list())Arguments
| Name | Description |
|---|---|
data | a dataframe of QTc dataset |
fit | the lme model to make predictions with |
conc_col | an unquoted column name of drug concentration measurements |
treatment_predictors | list of a values for contrast. CONC will update |
control_predictors | list of b values for contrast |
reference_threshold | optional vector of numbers to add as horizontal dashed lines |
cmaxes | Optional - numeric vector of Cmax values to add as reference lines |
conf_int | confidence interval fraction, default = 0.9 |
style | a named list of any argument that can be passed to style_plot |
Returns
a plot
Examples
data <- preprocess(data) fit <- fit_prespecified_model(   data,   deltaQTCF,   ID,   CONC,   deltaQTCFBL,   TRTG,   TAFD,   "REML",   TRUE ) pk_df <- compute_pk_parameters(   data %>% dplyr::filter(DOSE != 0), ID, DOSEF, CONC, NTLD)
 predict_with_exposure_plot(   data,   fit,   CONC,   treatment_predictors = list(     CONC = 0,     deltaQTCFBL = 0,     TRTG = "Verapamil HCL",     TAFD = "2 HR"   ),   control_predictors = list(     CONC = 0,     deltaQTCFBL = 0,     TRTG = "Placebo",     TAFD = "2 HR"   ),   cmaxes = pk_df[[1, "Cmax_gm"]], # Dose = 120 )