gof_residuals_trt_boxplots
Description
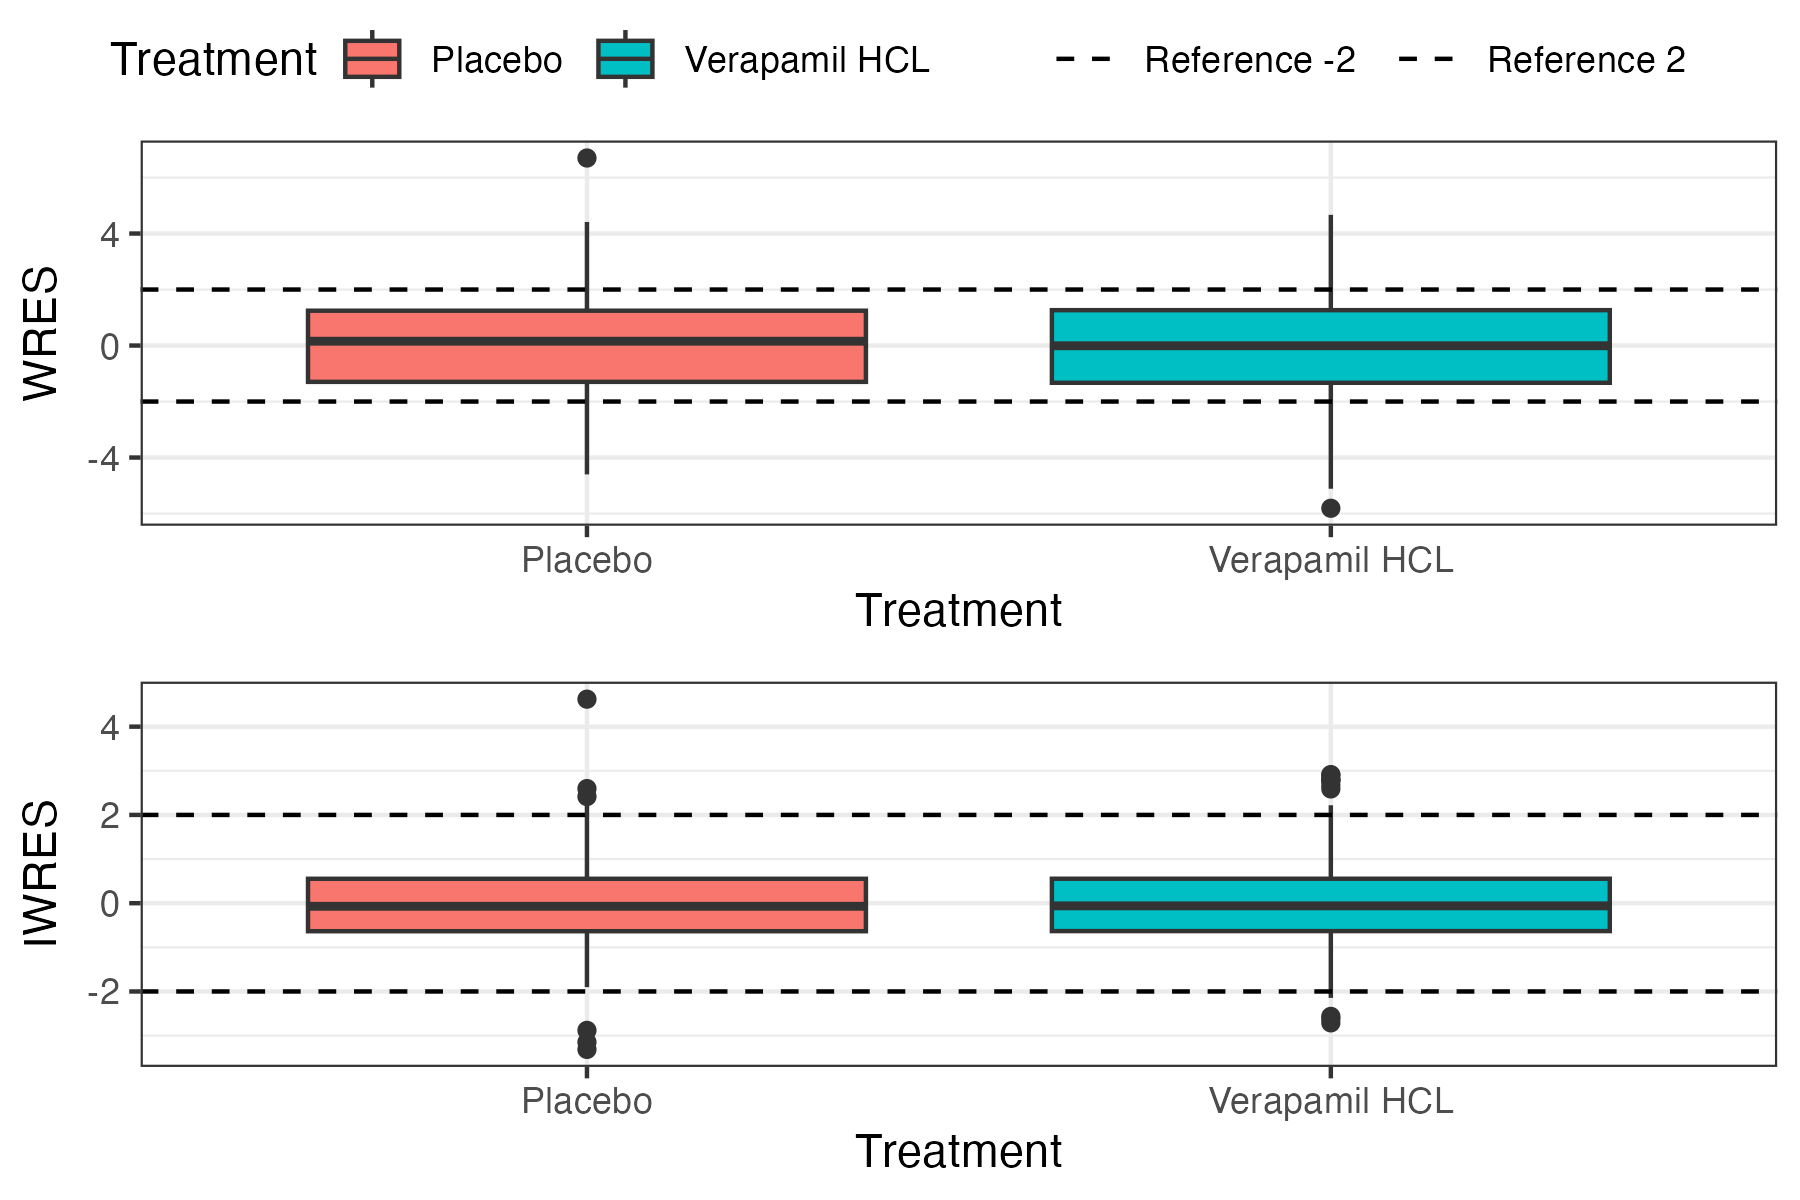
generates boxplots for treatment group
Usage
gof_residuals_trt_boxplots( data, fit, dv_col, conc_col, ntime_col, trt_col = NULL, residual_references = c( -2, 2), style = list())Arguments
| Name | Description |
|---|---|
data | A dataframe of QTc dataset |
fit | a deltaQTCF model fit |
dv_col | an unquoted column name of deltaQTC/Dependent variable measurements |
conc_col | an unquoted column name of concentration measurements |
ntime_col | an unquoted column name of nominal times |
trt_col | an unquoted column name of treatment group, default NULL |
residual_references | numeric vector of reference residual lines to add, default -2 and 2 |
style | a named list of any argument that can be passed to style_plot |
Returns
a ggarrange plot
Examples
data_proc <- preprocess(data) fit <- fit_prespecified_model( data_proc, deltaQTCF, ID, CONC, deltaQTCFBL, TRTG, TAFD, "REML", TRUE ) gof_residuals_trt_boxplots(data_proc, fit, deltaQTCF, CONC, NTLD, TRTG)