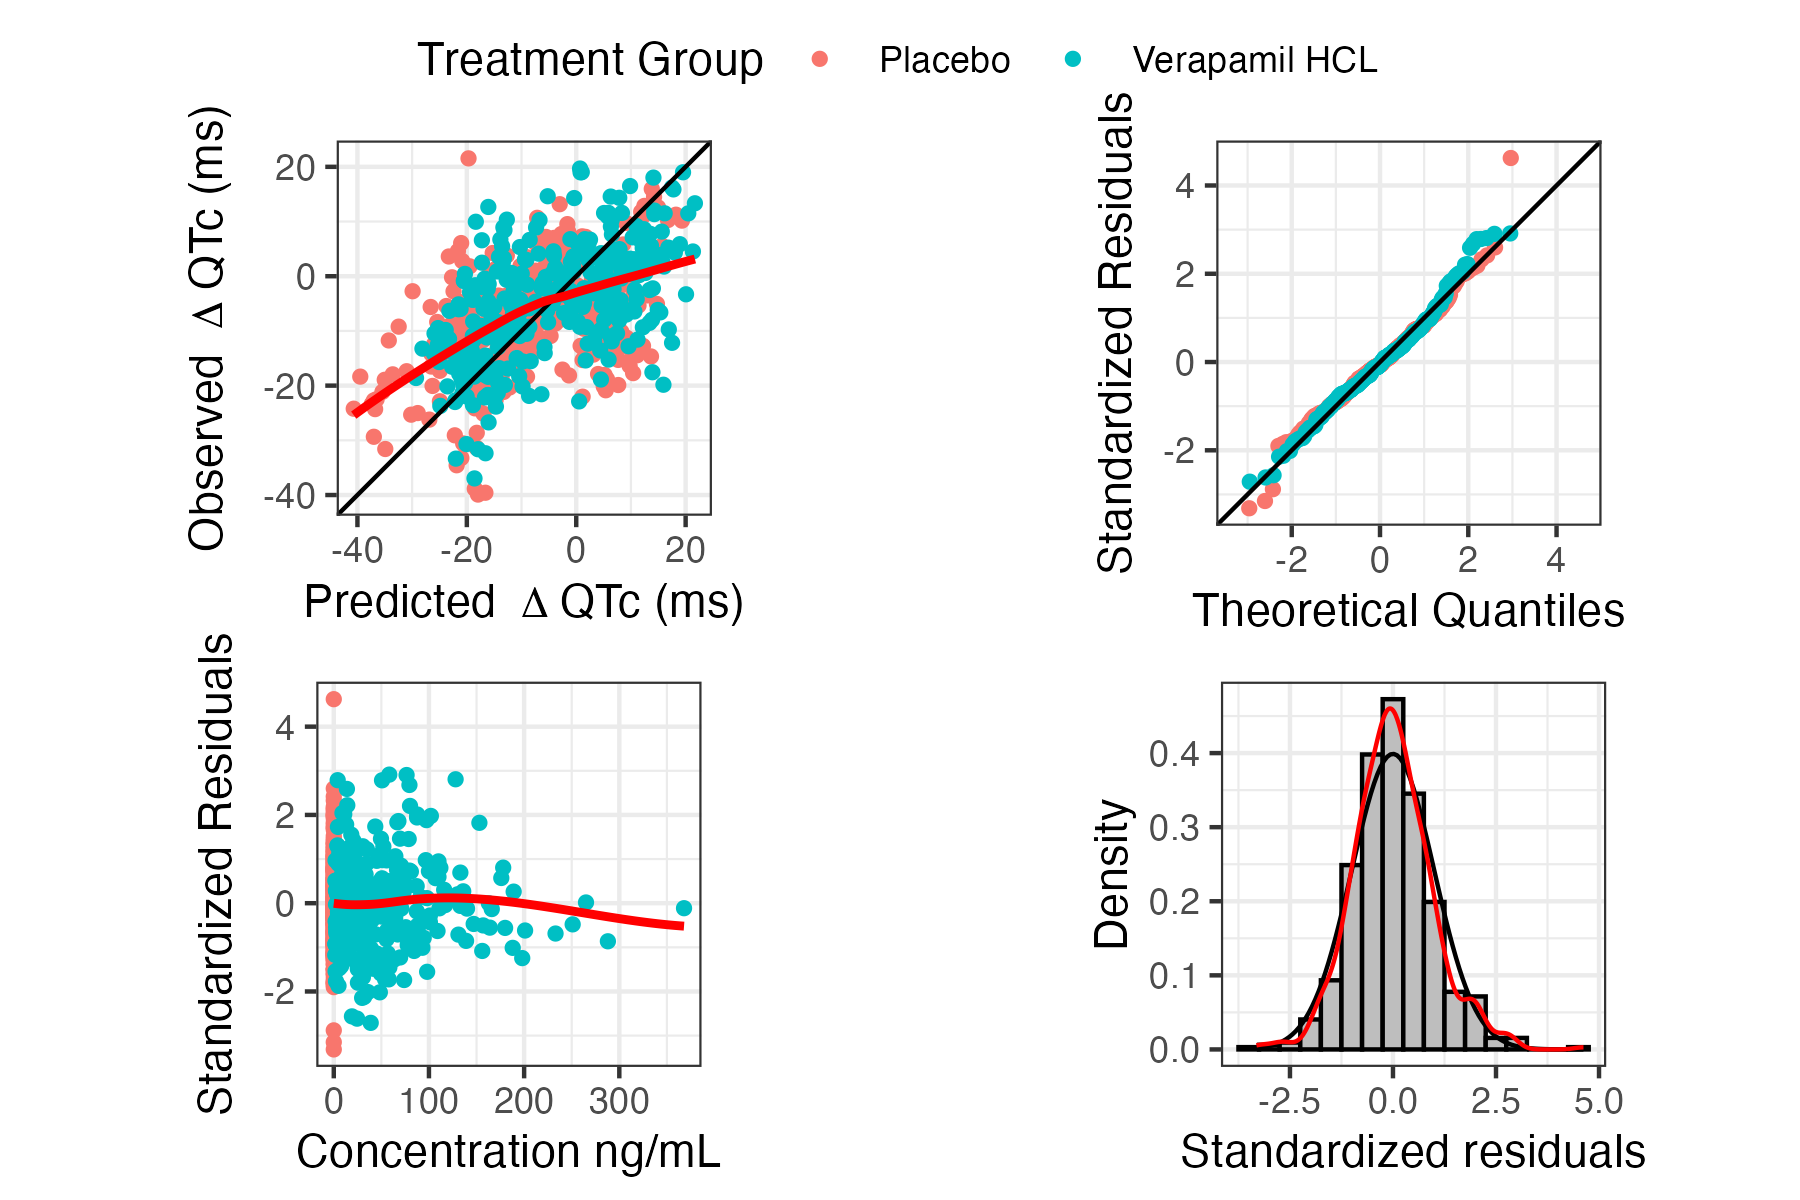
gof_plots
Description
Makes goodness of fit plots
Usage
gof_plots( data, fit, dv_col, conc_col, ntime_col, trt_col = NULL, conc_xlabel = "Concentration ng/mL", dv_label = bquote( Delta ~ "QTc ( ms)"), legend_location = c( "top", "bottom", "left", "right", "none"), style = list())Arguments
| Name | Description |
|---|---|
data | A dataframe of QTc dataset |
fit | a deltaQTCF model fit |
dv_col | an unquoted column name of deltaQTC/Dependent variable measurements |
conc_col | an unquoted column name of concentration measurements |
ntime_col | an unquoted column name of nominal times |
trt_col | an unquoted column name of treatment group, default NULL |
conc_xlabel | a string for concentration plot xlabel |
dv_label | a string of dv label default bquote(Delta ~ ‘QTc (ms)‘) |
legend_location | string for moving legend position. |
style | a named list of any argument that can be passed to style_plot |
Returns
a 2x2 grid of plots
Examples
data_proc <- preprocess(data) fit <- fit_prespecified_model(   data_proc,   deltaQTCF,   ID,   CONC,   deltaQTCFBL,   TRTG,   TAFD,   "REML",   TRUE )
 gof_plots(   data_proc,   fit,   deltaQTCF,   CONC,   NTLD,   TRTG)