eda_qt_rr_plot
Description
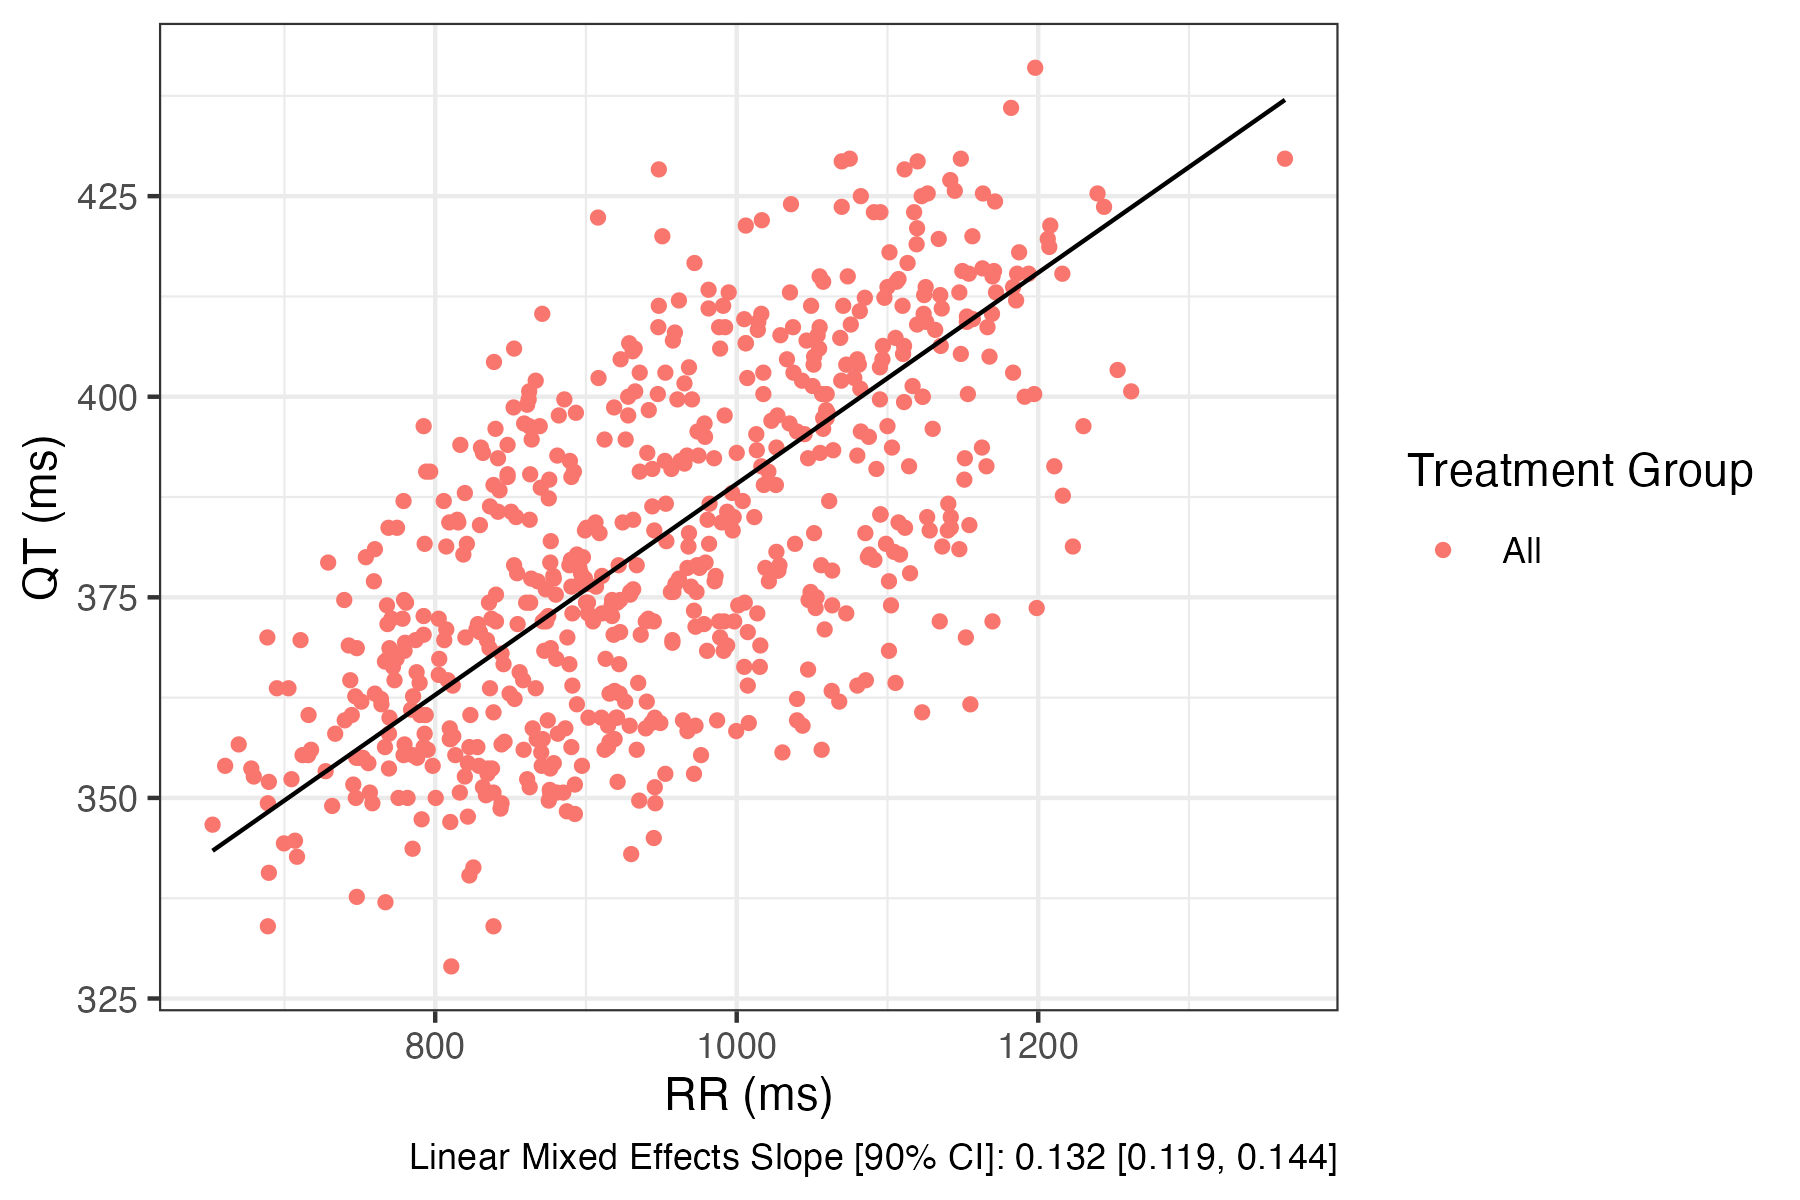
Plot QT against RR
Usage
eda_qt_rr_plot( data, rr_col, qt_col, id_col = NULL, trt_col = NULL, conf_int = 0.9, model_type = c( "lm", "lme"), show_model_results = TRUE, method = "REML", remove_rr_iiv = FALSE, style = list())Arguments
| Name | Description |
|---|---|
data | dataframe containing QT dataset |
rr_col | an unquoted column name of RR data |
qt_col | an unquoted column name of QT data |
id_col | an unquoted column name of ID data |
trt_col | an unquoted column name of Treatment group data |
conf_int | confidence interval for lm regression coefficients, default 0.90 |
model_type | lm or lme, which model to fit for showing on plot |
show_model_results | a bool for showing regression slope on plot. |
method | method for nlme::lme fitting |
remove_rr_iiv | a boolean for removing IIV on RR slope |
style | a named list of any argument that can be passed to style_plot |
Returns
a plot of the input QT against RR
Examples
data <- preprocess(data)
 eda_qt_rr_plot(data, RR, QT, ID, model_type = "lme")