eda_mean_dv_over_time
Description
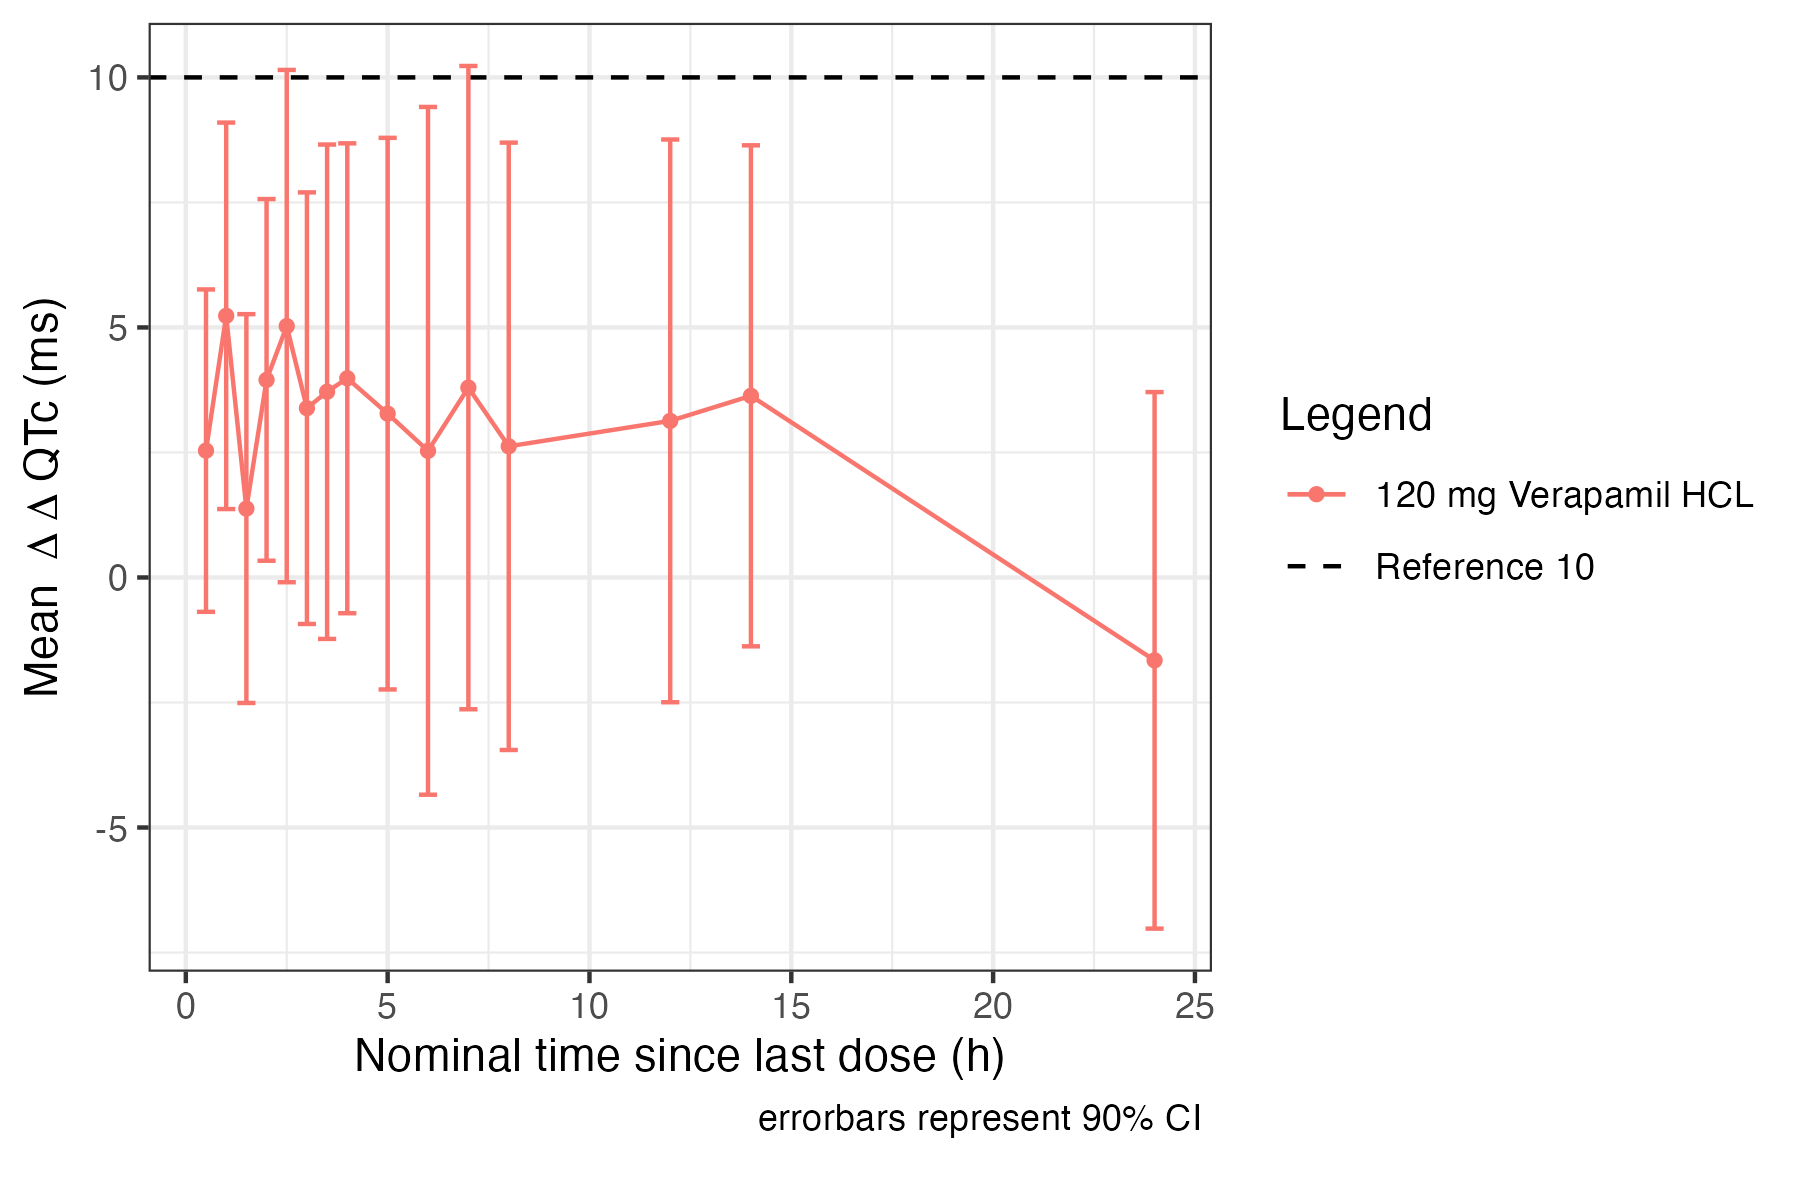
Plots mean dependent variable over time
Usage
eda_mean_dv_over_time( data, dv_col, ntime_col, dosef_col, secondary_data_col = NULL, group_col = NULL, reference_dose = NULL, reference_threshold = NULL, conf_int = 0.9, scale_factor = NULL, shift_factor = NULL, error_bars = "CI", sec_ylabel = "Concentration ( ng/mL)", style = list())Arguments
| Name | Description |
|---|---|
data | dataframe containing QTc dataset |
dv_col | an unquoted column name of dependent variable |
ntime_col | an unquoted column name of nominal Time grouping |
dosef_col | an unquoted column name of Dose grouping |
secondary_data_col | optional unquoted column name to overlay on secondary y-axis |
group_col | an unquoted column name of additional grouping column |
reference_dose | Optional - DOSE of reference (i.e. placebo, DOSE == 0) measurements |
reference_threshold | Optional - a numeric or vector of numerics to add dashed lines to plot |
conf_int | fractional confidence interval, default = 0.9 |
scale_factor | optional scale factor for scaling secondary_data_col |
shift_factor | optional additive factory for shifting secondary data |
error_bars | a string for setting which errorbars are shown, CI, SE, SD |
sec_ylabel | a string for secondary ylabel, default is Concentration (ng/mL) |
style | a named list of any argument that can be passed to style_plots. Shapes are mapped to grouping variables and can be controlled via the shapes parameter in style |
Returns
a plot
Examples
data <- preprocess(data)
 eda_mean_dv_over_time(   data,   deltaQTCF,   NTLD,   DOSEF,   group_col = TRTG,   reference_dose = "0 mg",   reference_threshold = 10,   style = set_style(ylabel = bquote('Mean '~Delta~Delta~'QTc (ms)')))