eda_hysteresis_loop_plot
Description
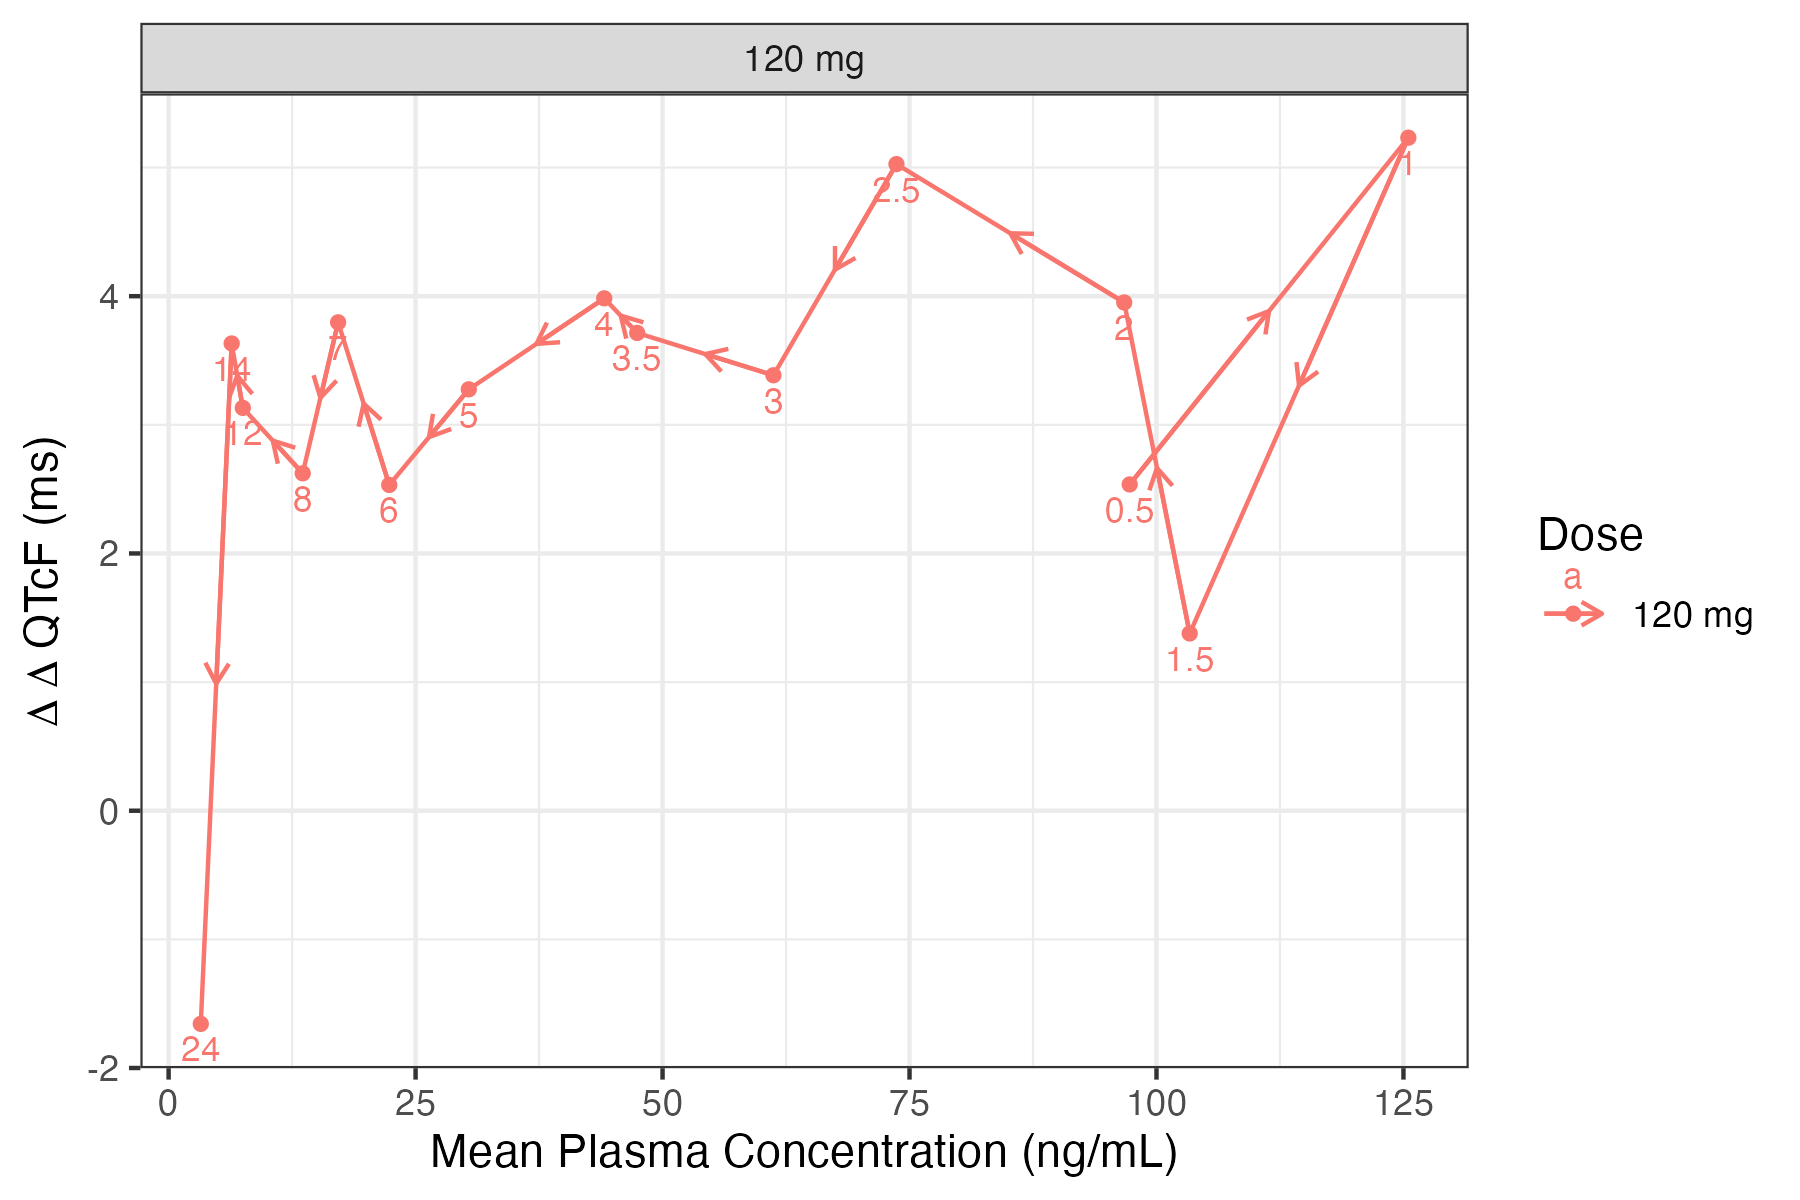
Hysteresis loop plot to visually inspect hysteresis
Usage
eda_hysteresis_loop_plot( data, ntime_col, deltaqtc_col, conc_col, dosef_col, group_col = NULL, reference_dose = NULL, show_hysteresis_warning = TRUE, style = list())Arguments
| Name | Description |
|---|---|
data | a dataframe of QTc dataset |
ntime_col | an unquoted column name of nominal time points |
deltaqtc_col | an unquoted column name of dQTC measurements at the time points in NTLD |
conc_col | an unquoted column name of drug concentrations at each NTLD |
dosef_col | an unquoted column name of DOSE factors. |
group_col | an unquoted column name of additional grouping column |
reference_dose | Optional - DOSE of reference (i.e. placebo, DOSE == 0) measurements |
show_hysteresis_warning | boolean, if TRUE adds Hysteresis Detected to facet wrap label for groups with hysteresis detected |
style | a named list of any argument that can be passed to style_plot |
Returns
a plot
Examples
data <- preprocess(data)
 eda_hysteresis_loop_plot(   data,   NTLD,   deltaQTCF,   CONC,   DOSEF,   reference_dose = "0 mg",   style = set_style(     ylabel = bquote(Delta~Delta~"QTcF (ms)")   ) )